Donut Chart for Market Share Visualization – Secure Your Competitive Edge
RB0800071_6
- Last Update 03/28/2025
- File Size 5.4MB
- # of Slides 2
- File Format PPTX
- Slide Ratio 4:3
- Color
Keywords
About the Product
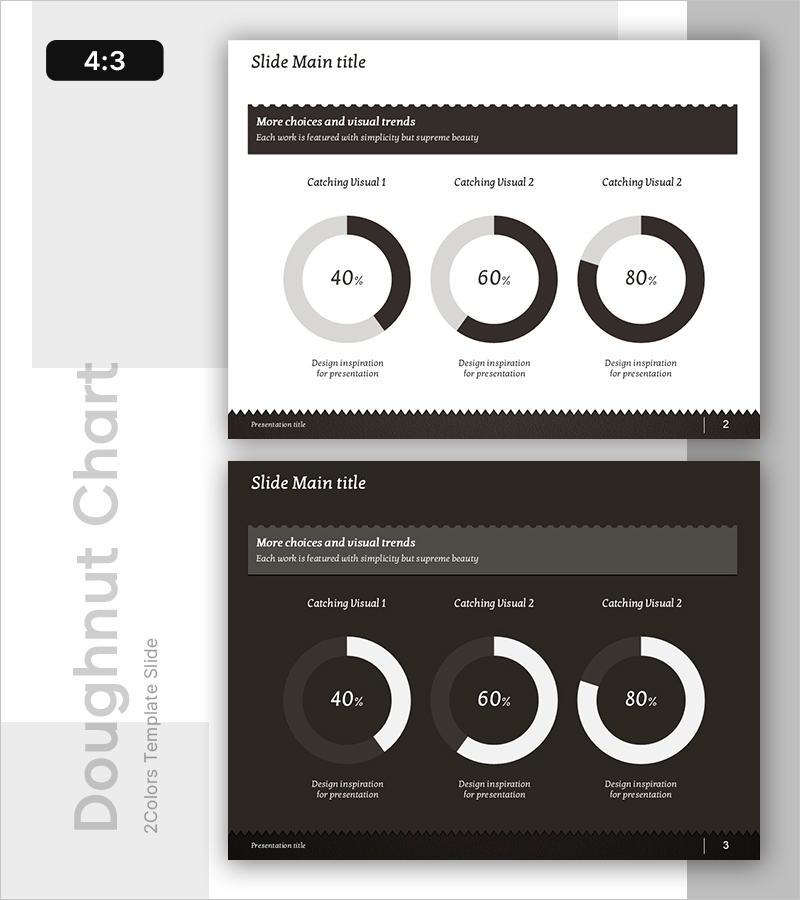
A PowerPoint slide template featuring three donut-shaped pie charts for visualizing market share, sales distribution, revenue breakdown, and customer composition data. The design uses a black and gray two-tone background with white donut charts to clearly display percentage values (40%, 60%, 80%). Each chart includes a descriptive text area below for adding analysis details. This 4:3 aspect ratio template consists of 2 fully editable slides, perfect for business presentations, quarterly reports, and strategic analysis decks.
Usage Points
-
Main Usage
Ideal for presenting proportional data such as market share, sales breakdown, budget allocation, and customer segments. The three independent donut charts allow simultaneous comparison of multiple datasets on a single slide, making complex data easy to understand at a glance.
-
How to Use
Replace the sample percentages (40%, 60%, 80%) with your actual data values. Add analysis text in the description areas below each chart. The black, gray, and white color scheme works well for both printed reports and digital presentations. Simply edit the numbers and labels to customize for your specific business needs.
-
Recommended For
Finance teams presenting budget allocation, marketing teams analyzing market segments, sales teams reviewing customer composition, executive dashboards, quarterly business reviews, and strategic planning presentations. Suitable for any data-driven business presentation requiring clear ratio visualization.
-
Slide Structure
2-slide template in 4:3 aspect ratio. Slide 1: Title area with 3 donut charts displaying percentage data (40%, 60%, 80%) and descriptive text fields below each chart. Slide 2: Dark background version with identical layout. All elements are fully editable in PPTX format.
Related Products
-

Sales Status by Food Truck Product – Market Share Analysis
#Market and Competitor Analysis #Graph #Market Status
-

Smoking Rates among Lung Cancer Patients – Market Analysis
#Market and Competitor Analysis #Graph #Market Status
-
![Analysis of [3 Key Factors] with Donut Chart - Market Status and Share](https://image.goodpello.com/2025/08/16/9c5d48b8-118b-499e-a39c-4b78a2acdc1e.jpg?w=300&h=336&format=auto)
Analysis of [3 Key Factors] with Donut Chart - Market Status and Share
#Market and Competitor Analysis #Graph #Market Status
-

Visualized Travel Transportation Preference Survey with Doughnut Chart
#Market and Competitor Analysis #Graph #Market Status
