Donut Chart Slide for Game Category Analysis
RJ0800026_7
- Last Update 08/07/2025
- File Size 0.5MB
- # of Slides 2
- File Format PPTX
- Slide Ratio 16:9
- Color
Keywords
About the Product
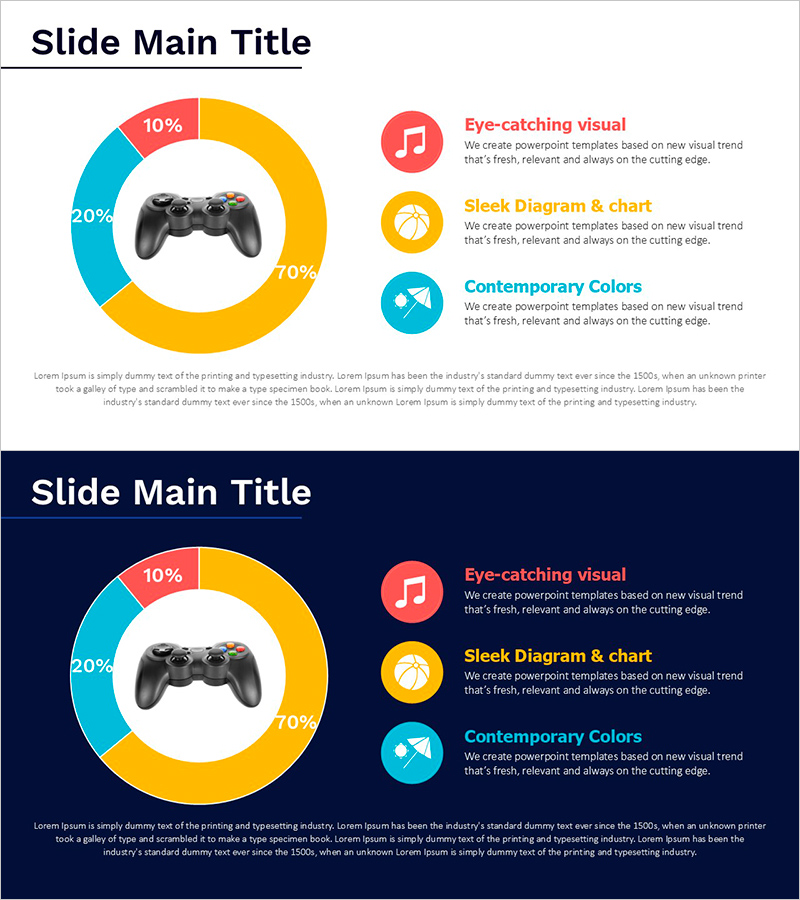
A PowerPoint donut chart slide displaying game category market share across four segments with red, yellow, blue, and cyan colors for clear differentiation. Features a game controller icon in the center to visually reinforce the gaming industry theme. Includes two layout versions—light background and dark background—allowing flexible adaptation to any presentation environment. Percentage values are displayed for each segment, making it immediately applicable for competitive analysis, market share reporting, gaming genre distribution, and business data visualization.
Usage Points
-
Main Usage
Visualize gaming industry category market share, competitive positioning, and user distribution through a donut chart to enhance data credibility in presentations. The center icon clarifies the topic while color-coded segments enable instant category recognition.
-
How to Use
Insert into marketing plans, business reports, or investor pitch decks within the market analysis section to explain gaming genre market share. Edit segment percentages with your own data and select the background version matching your overall slide design theme.
-
Recommended For
Game company marketing teams, gaming industry analysts, game developer executives, gaming platform strategists, and game distribution sales teams presenting market overview, competitive analysis, and business strategy.
-
Slide Structure
Donut chart with 4 segments (10%, 20%, 70%, and additional ratio indicators), center game controller icon, right-side legend with 3 items (music icon, basketball icon, camera icon), bottom descriptive text area. Two layout options: light background and dark background.
Related Products
-

Donut Chart for Components and Market Share Visualization – Market Analysis
#Market and Competitor Analysis #Graph #Market Status
-

Distribution Graph of Food Materials – Market Status Chart
#Market and Competitor Analysis #Graph #Other
-

Visualizing Value Ratios with Pie Charts – Essential Presentation Template
#Market and Competitor Analysis #Diagram #Graph
-

Visualizing Fish Market Share with Doughnut Chart – Vitality of the Ocean
#Market and Competitor Analysis #Graph #Market Status
