Construction Site Donut Chart – Market Share Visualization
RJ0300012_5
- Last Update 04/21/2025
- File Size 1.1MB
- # of Slides 2
- File Format PPTX
- Slide Ratio 16:9
- Color
Keywords
About the Product
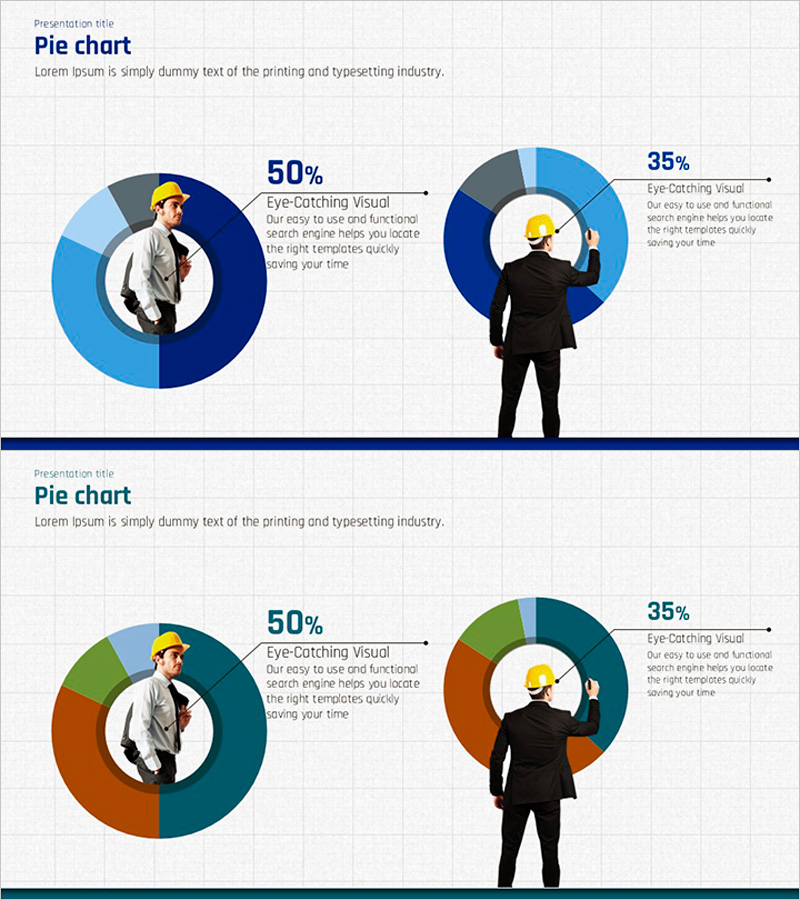
A professional donut chart PowerPoint slide set designed to visualize market share and competitive analysis with clarity and impact. This 2-slide template offers two distinct color schemes—blue and gray tones paired with green and orange tones—allowing you to select the palette that best matches your presentation theme. Each slide features a centered worker silhouette illustration that brings business context to life, with percentage values and descriptive text areas clearly separated for easy data interpretation. Delivered in 16:9 widescreen PPTX format, these slides are fully editable and ready to integrate into marketing strategies, business analyses, investor presentations, and competitive positioning reports.
Usage Points
-
Main Usage
Ideal for presenting two parallel data sets such as market share distribution, competitive comparison, or business segment ratios. The donut structure leverages the central space to highlight key metrics or titles, drawing audience focus to critical information.
-
How to Use
Deploy in market analysis sections of marketing plans, performance comparisons in business reports, or competitive landscape presentations in investor meetings. Simply replace the percentage values and labels with your own data, and adjust the color scheme to align with your corporate brand identity for a polished, professional result.
-
Recommended For
Marketing managers, business analysts, executive report coordinators, consultants, and strategy professionals who need to communicate market conditions and competitive positioning. Particularly effective when comparing two distinct ratio sets simultaneously.
-
Slide Structure
2-slide set with dual donut charts per slide (3–4 segments each). Worker silhouette illustration centered, percentage values and descriptive text positioned on the right. Title area at top, dividing line at bottom for clear visual hierarchy and professional appearance.
Related Products
-

Smoking Rates among Lung Cancer Patients – Market Analysis
#Market and Competitor Analysis #Graph #Market Status
-

Donut Chart PPT Template for Market Overview
#Market and Competitor Analysis #Graph #Market Status
-

Eucalyptus Donut Chart – Visualization for Market Analysis
#Market and Competitor Analysis #Graph #Market Status
-

Energy Resource Management Share Analysis – Market Share Visualization
#Market and Competitor Analysis #Graph #Market Status
