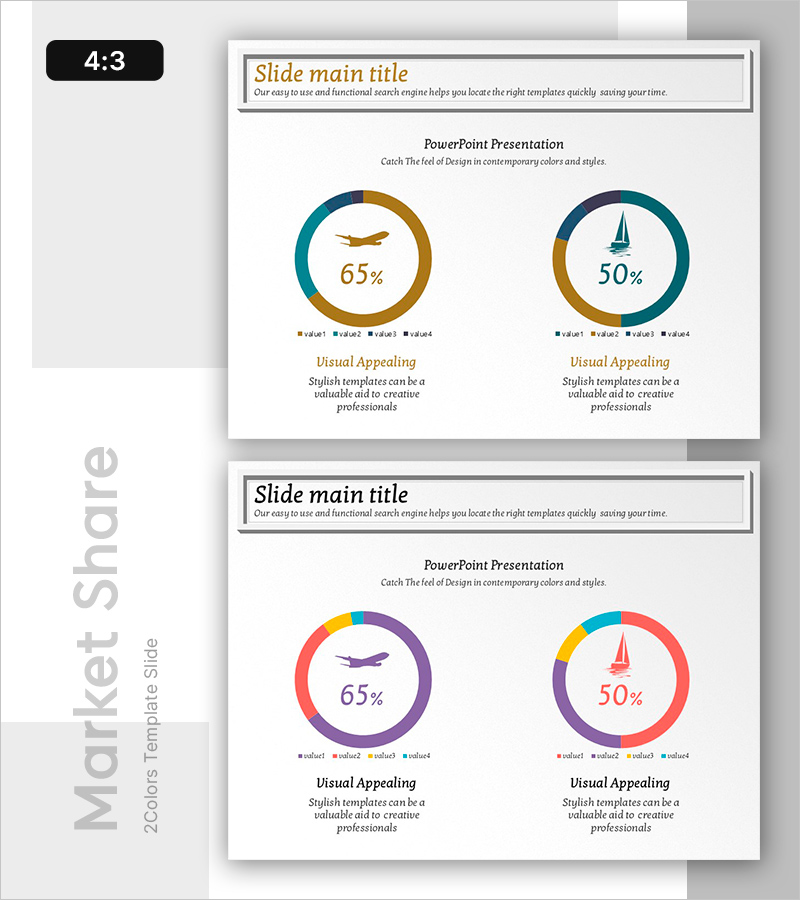
Visualized Travel Transportation Preference Survey with Doughnut Chart
RB0600025_3
- Last Update 03/15/2025
- File Size 1MB
- # of Slides 2
- File Format PPTX
- Slide Ratio 4:3
- Color
Keywords
About the Product
A 2-slide PowerPoint presentation visualizing travel transportation preferences using dual doughnut charts with teal and gold gradient coloring. Each circular chart displays percentage data (65% and 50%) with centered icons—an airplane and sailboat—to represent transportation modes intuitively. Formatted in 4:3 aspect ratio PPTX, this slide deck is fully editable and ready for market research presentations, travel industry analysis, and statistical data visualization in business reports.
Usage Points
-
Main Usage
Visualize travel transportation preference survey results using dual doughnut charts to communicate market analysis and statistical data effectively. Airplane and sailboat icons provide intuitive transportation representation, while 65% and 50% ratios enable clear comparative analysis.
-
How to Use
Integrate into travel industry presentations, marketing strategy documents, and market research reports for data visualization sections. Position the two doughnut charts side-by-side to compare preferences across different demographics or time periods. Customize legend and text labels to apply to various statistical datasets and survey outcomes.
-
Recommended For
Travel agencies, tourism boards, airlines, and transportation companies' marketing professionals; market research analysts; tourism industry consultants; and business intelligence specialists presenting preference survey findings in reports and presentations.
-
Slide Structure
2-slide deck with dual doughnut charts positioned horizontally on each slide. Layout includes title area at top, centered teal-gold gradient pie charts with embedded icons, and legend with descriptive text at bottom in 4:3 aspect ratio format.
Related Products
-

Visualizing Market Share with Detailed Item Analysis Chart
#Market and Competitor Analysis #Diagram #Graph
-

Weather Analysis Donut Chart – Visualizing Market Status and Share
#Market and Competitor Analysis #Graph #Market Status
-

Construction Site Donut Chart – Market Share Visualization
#Market and Competitor Analysis #Graph #Market Status
-
![Analysis of [3 Key Factors] with Donut Chart - Market Status and Share](https://image.goodpello.com/2025/08/16/9c5d48b8-118b-499e-a39c-4b78a2acdc1e.jpg?w=300&h=336&format=auto)
Analysis of [3 Key Factors] with Donut Chart - Market Status and Share
#Market and Competitor Analysis #Graph #Market Status
