Competition Creative Chart – Essential Tool for Market Advantage
RB0800070_7
- Last Update 03/27/2025
- File Size 0.1MB
- # of Slides 2
- File Format PPTX
- Slide Ratio 4:3
- Color
Keywords
About the Product
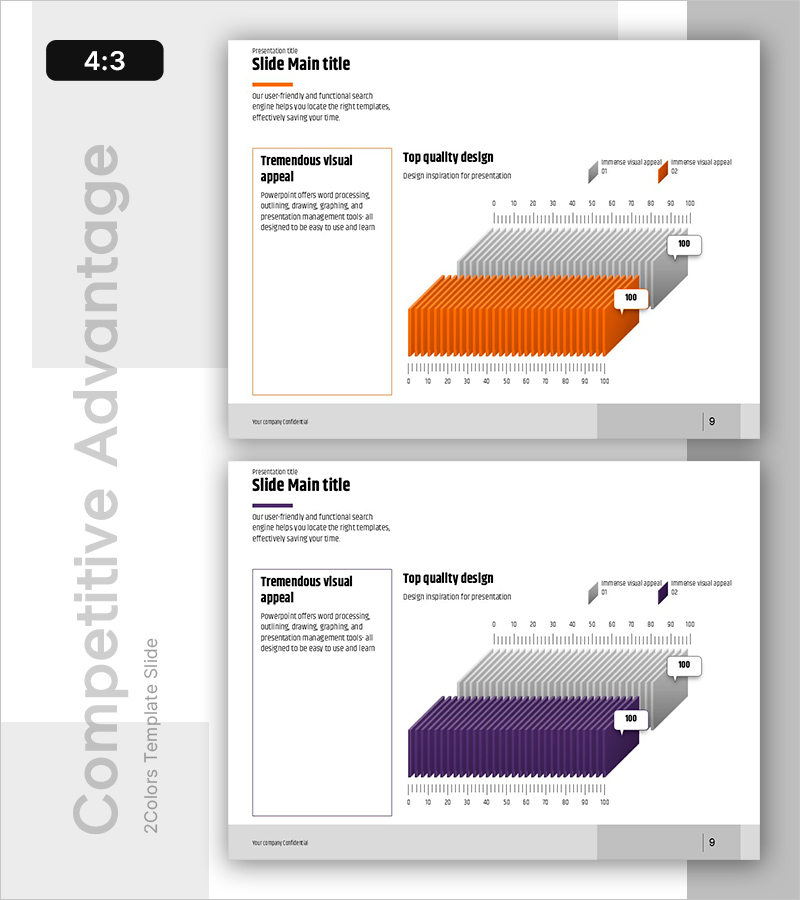
A 2-slide PowerPoint presentation showcasing market competitiveness through 3D visualization. The orange and gray 3D bar chart clearly communicates competitive positioning against rivals. The left text box accommodates key messaging while the right 3D chart displays quantitative data, making it ideal for investor pitches, strategy meetings, and marketing presentations. Delivered in 4:3 PPTX format, fully editable across all PowerPoint versions.
Usage Points
-
Main Usage
Clearly communicate your company's strengths against competitors using data-driven 3D visualization. The 3D bar chart emphasizes data superiority while the left text area reinforces key messages, boosting persuasiveness. Perfect for investor presentations, executive briefings, and marketing strategy sessions to establish competitive positioning.
-
How to Use
Enter 3–4 core competitive strengths in the left 'Competitive Advantage Analysis' text box. Replace the 3D chart values (0–100 scale) with your company and competitor data, then swap the legend icons with company logos. Adjust chart colors (orange/gray) to match your brand palette for seamless integration.
-
Recommended For
Ideal for C-suite investor pitches, strategy team market analysis reports, marketing team competitive benchmarking, and sales team client proposals. Particularly effective for B2B presentations and funding pitches where quantitative differentiation is critical.
-
Slide Structure
Two-slide layout with each slide featuring a left text input area (title + 3–4 description lines) and a right 3D bar chart (2 data series comparison, 0–100 scale, 2 legend items). Slide 1 emphasizes orange; Slide 2 features purple accent, providing color variations for multiple competitive scenarios.
Related Products
-

World Travel Template Area Chart
#Market and Competitor Analysis #Graph #Other
-

Meat and Vegetable Consumption by Region – Market Status Analysis
#Market and Competitor Analysis #Graph #Other
-

Sports Future Expected Effects and Numerical Graphs
#Market and Competitor Analysis #Graph #Other
-

Area Graph – Effective Visualization for Market and Competitor Analysis
#Market and Competitor Analysis #Graph #Other
