Graph of Changes in Real Estate Sales Due to Changes in Interest Rates
RJ0900010_27
- Last Update 08/18/2025
- File Size 14.3MB
- # of Slides 2
- File Format PPTX
- Slide Ratio 16:9
- Color
Keywords
- #Content-Based Slides
- #Design-Based Slides
- #Business Strategy
- #Market and Competitor Analysis
- #Graph
- #Other
- #Achievements
- #Competitive Advantage
- #16:9
- #real estate sales graph PowerPoint
- #interest rate change slide
- #stacked area chart PPT
- #market analysis presentation
- #how to visualize real estate trends in PowerPoint
About the Product
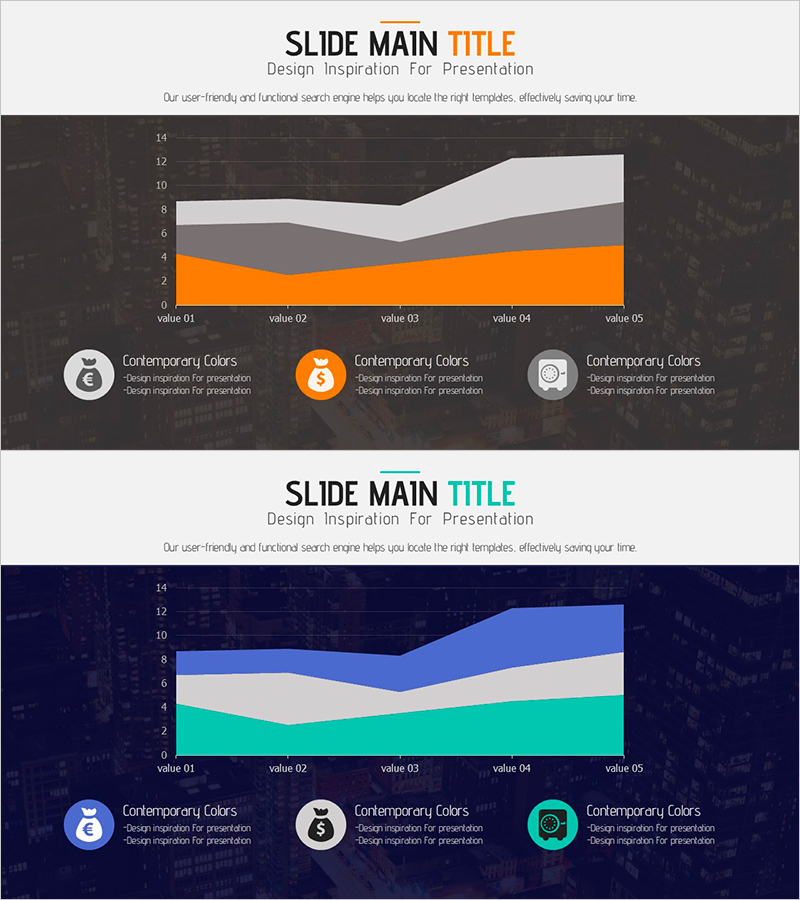
A PowerPoint slide that visualizes real estate sales trends in response to interest rate fluctuations. This presentation template uses a stacked area chart to display data across five time points, making it easy to see how sales volume changes over time. The layered design in orange, gray, and white clearly distinguishes multi-level data, while three icon sections at the bottom allow you to add text descriptions for each stage. Perfect for real estate market analysis, investor presentations, and business strategy discussions where you need to communicate the relationship between interest rates and sales performance. Available in 16:9 PPTX format for immediate editing in any presentation software.
Usage Points
-
Main Usage
This slide is designed to visually analyze and communicate the correlation between interest rate changes and real estate sales volume. The stacked area chart displays cumulative data across five time periods, allowing viewers to instantly grasp how trends shift over time.
-
How to Use
Use this slide in investor relations (IR) presentations, real estate market analysis reports, business strategy meetings, and financial institution presentations to explain the cause-and-effect relationship between interest rates and sales. Add market characteristics or strategic insights to the three icon sections at the bottom to strengthen your storytelling.
-
Recommended For
Real estate developers, construction company executives, financial analysts, real estate investment fund managers, market research professionals, and business leaders preparing data-driven presentations will find this slide particularly useful for supporting decision-making.
-
Slide Structure
The slide consists of a title area at the top, a 5-step stacked area chart in the center (Y-axis 0–14, X-axis with 5 data points), and three circular icon sections with text descriptions at the bottom. Each layer (orange, gray, white) is independently editable, and you can modify values and legends to match your actual data.
Related Products
-

Bar Chart Visualizing Steak Consumption
#Business Strategy #Market and Competitor Analysis #Graph
-

Ice Hockey Competition Chart – Performance Analysis and Strategy
#Business Strategy #Market and Competitor Analysis #Graph
-

Progress Donut Chart for Each Library Service
#Business Strategy #Market and Competitor Analysis #Graph
-

Slanted Horizontal Bar Graph – Visual Tool for Business Strategy
#Business Strategy #Market and Competitor Analysis #Graph
