Analysis of Climbing Success Rate with Doughnut Chart
RJ0800044_16
- Last Update 08/12/2025
- File Size 0.9MB
- # of Slides 2
- File Format PPTX
- Slide Ratio 16:9
- Color
Keywords
- #Content-Based Slides
- #Design-Based Slides
- #Business Strategy
- #Market and Competitor Analysis
- #Graph
- #Other
- #Achievements
- #Competitive Advantage
- #Circles
- #Doughnut Chart
- #Mockup
- #16:9
- #doughnut chart PowerPoint
- #pie chart slide template
- #success rate visualization
- #achievement metrics PPT
- #circular chart presentation
About the Product
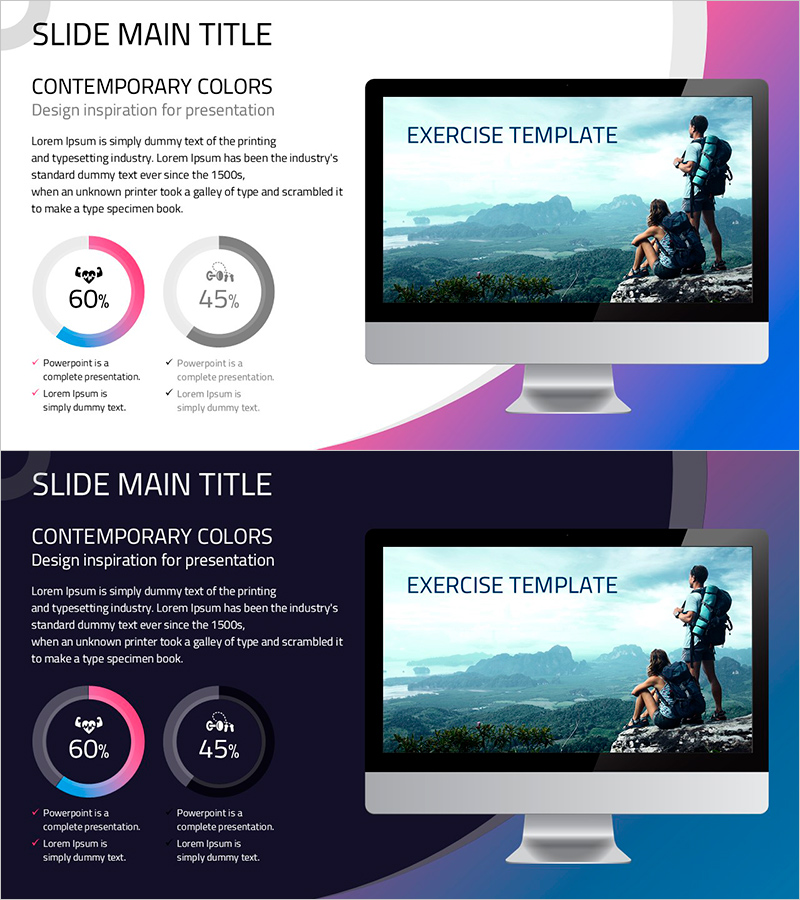
A 2-slide PowerPoint presentation featuring doughnut chart visualization of climbing success rates. The slides showcase a pink-to-blue gradient background with two circular charts displaying 60% and 45% achievement metrics. Each chart includes descriptive text labels and checkmark lists for detailed data breakdown. Ready-to-use for presentations and reports, with fully editable numbers, colors, and text fields for customization.
Usage Points
-
Main Usage
Visualize performance metrics, achievement rates, and success percentages using doughnut charts to communicate data clearly to audiences. Applicable to climbing expeditions, project completion rates, sales targets, and performance analysis across industries.
-
How to Use
Open the slides and replace the chart values (60%, 45%) with your actual data. Update text descriptions and labels to match your content. Customize the pink-blue gradient background or change colors as needed. Insert into presentations, reports, or business proposals for immediate use.
-
Recommended For
Marketing professionals, project managers, sales teams, educators, and business analysts who need to present performance data visually. Ideal for quarterly performance reviews, goal achievement tracking, project progress reports, and strategic presentations.
-
Slide Structure
2-slide layout in 16:9 widescreen format (PPTX). Slide 1: Title and subtitle at top-left, 60% doughnut chart center with pink-blue gradient, checkmark list on right. Slide 2: 45% doughnut chart with supporting text. Both slides feature consistent color scheme and professional spacing.
Related Products
-

Visualizing Business Performance with Tube Donut Chart – Strategies for Competitive Advantage
#Business Strategy #Market and Competitor Analysis #Graph
-

Yoga's Advantage Donut Chart – Path to Wellness
#Business Strategy #Market and Competitor Analysis #Graph
-

Construction Facilities Status Donut Chart – Visualizing Business Strategies
#Business Strategy #Market and Competitor Analysis #Graph
-

Progress Donut Chart for Each Library Service
#Business Strategy #Market and Competitor Analysis #Graph
