Negative Vertical Bar Chart – Emphasis on Financial Performance
RB0800070_5
- Last Update 03/27/2025
- File Size 0.2MB
- # of Slides 2
- File Format PPTX
- Slide Ratio 4:3
- Color
Keywords
- #Content-Based Slides
- #Design-Based Slides
- #Financial Plans and Performance
- #Graph
- #Budget
- #Sales and Revenue
- #Column
- #Column Chart
- #4:3
- #negative vertical bar chart PowerPoint
- #negative bar graph slide template
- #financial performance chart PPT
- #budget comparison chart PowerPoint
- #how to create negative bar chart in PowerPoint
About the Product
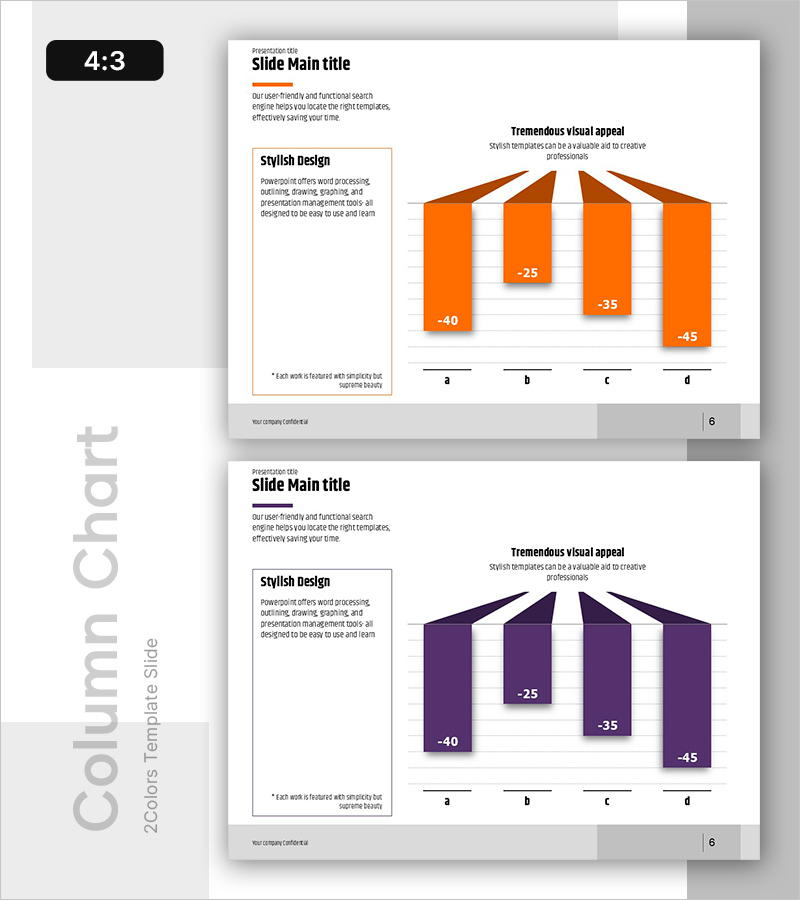
A negative vertical bar chart PowerPoint slide designed to emphasize financial performance and budget variance. The 3D orange bars with negative value indicators (-40, -25, -35, -45) provide intuitive visualization of cost reduction, revenue decline, and loss figures across four items (a, b, c, d). Each bar displays precise numerical data, enabling clear comparison of financial metrics. This presentation template is ready for immediate use in accounting reports, financial analysis presentations, and budget review meetings.
Usage Points
-
Main Usage
Data visualization for financial reports, accounting analysis, and budget reviews where negative values (losses, cost reductions, revenue declines) require emphasis. The four-item comparison clearly communicates performance variance and critical issues, making it ideal for executive briefings and board presentations.
-
How to Use
Replace the negative values (-40, -25, -35, -45) with actual financial data and update item labels (a, b, c, d) with department names, product names, or quarter identifiers. Maintain the orange color scheme or adjust to match corporate branding. Insert into financial analysis presentations, quarterly performance reviews, and budget planning meetings.
-
Recommended For
CFOs, financial managers, and accounting teams presenting loss figures, cost reductions, and revenue declines to executives, boards, and investors. Also suitable for consultants, financial analysts, and corporate trainers explaining financial improvements, risk factors, and performance variance in presentations.
-
Slide Structure
Two-slide layout: Slide 1 features title, descriptive text, and a 4-item negative vertical bar chart with orange 3D bars and negative value labels. Slide 2 presents the same chart in dark purple tones, offering color variation options. Each bar includes 3D effects and precise negative value indicators, optimized for 4:3 aspect ratio.
Related Products
-

Social Contribution Spending Chart – Key to Financial Planning
#Financial Plans and Performance #Graph #Budget
-

Car Wide Template Vertical Bar Graph – Market Analysis and Competitive Advantage
#Market and Competitor Analysis #Financial Plans and Performance #Graph
-

Vertical Bar Column Chart (Orange & Green) – Visualizing Sales Performance
#Market and Competitor Analysis #Financial Plans and Performance #Graph
-

Breaking Sales Records – Visualizing Performance
#Business Strategy #Financial Plans and Performance #Graph
