Polygonal Template Vertical Bar Graph – Market Analysis and Financial Planning
RB0800027_6
- Last Update 03/23/2025
- File Size 0.4MB
- # of Slides 2
- File Format PPTX
- Slide Ratio 4:3
- Color
Keywords
- #Content-Based Slides
- #Design-Based Slides
- #Market and Competitor Analysis
- #Financial Plans and Performance
- #Graph
- #Future Outlook
- #Sales and Revenue
- #Column
- #Column Chart
- #4:3
- #vertical bar chart PowerPoint
- #bar graph slide template
- #data comparison chart
- #market analysis PowerPoint
- #financial performance slide
- #data visualization template
About the Product
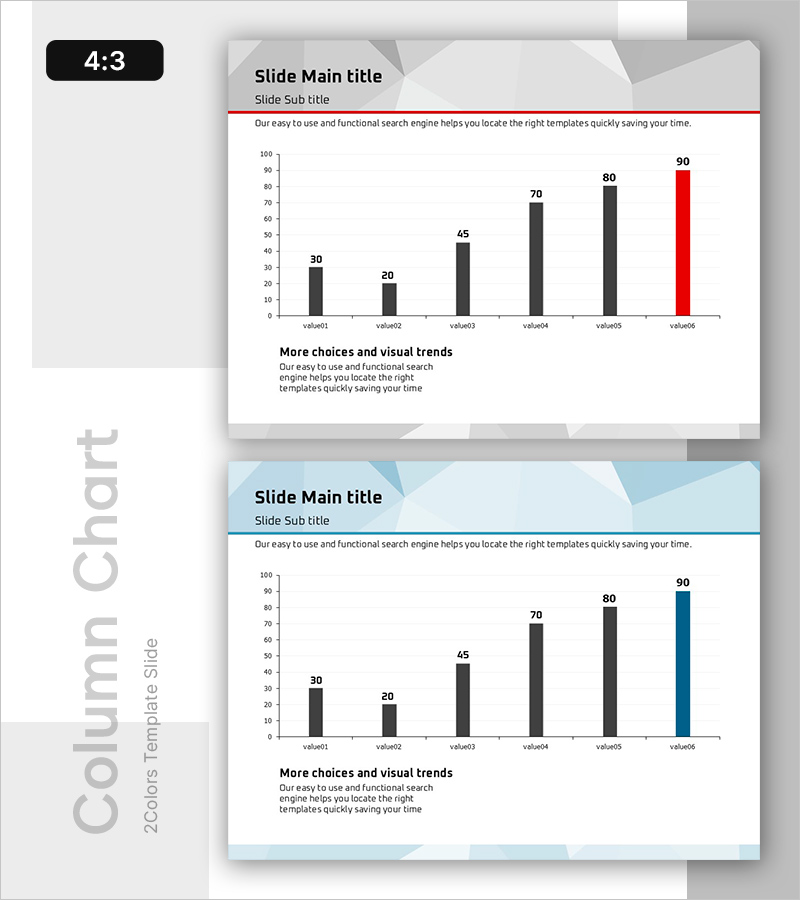
A vertical bar chart PowerPoint slide comparing six data values with visual emphasis. Five bars display in black while one bar highlights in red to draw attention to the peak value. This 4:3 aspect ratio, 2-slide set is ready for immediate use in market analysis, financial performance reports, and sales presentations. Includes editable title, subtitle, and description text areas for easy customization. Geometric background design conveys professional credibility.
Usage Points
-
Main Usage
Visualize and compare six numerical values using bar height, with color emphasis highlighting the peak or target value. Ideal for presenting market size, revenue figures, performance metrics, or competitive benchmarking in a clear, professional manner.
-
How to Use
Edit the title, subtitle, and description text fields with your presentation content. Replace the bar values with your actual data. Assign the black bars as baseline values and the red bar as the highest or target value to maximize comparison impact.
-
Recommended For
Finance teams presenting quarterly or annual performance reports, marketing teams analyzing market trends and competitor positioning, sales teams showcasing revenue results, and executives briefing investors or stakeholders. Adds credibility to data-driven presentations.
-
Slide Structure
Slide 1: Title, subtitle, and description text with 6-item vertical bar chart (5 black bars, 1 red bar). Slide 2: Alternate color version with gray background and blue emphasis. 4:3 aspect ratio, PPTX format, 2-slide set.
Related Products
-

Before and After 3D Comparison Graph – Market and Performance Analysis
#Market and Competitor Analysis #Financial Plans and Performance #Graph
-

Future Outlook Analysis Bar Graph – Essential for Market Analysis
#Market and Competitor Analysis #Graph #Future Outlook
-

Line Graph Visualizing Future Market Outlook for Sailing Travel
#Market and Competitor Analysis #Financial Plans and Performance #Graph
-

Basic Vertical Bar Chart Slide – Market Status Analysis
#Market and Competitor Analysis #Financial Plans and Performance #Graph
