Detailed Analysis in Book Illustration PowerPoint Template
RJ0500038_26
- Last Update 06/17/2025
- File Size 0.4MB
- # of Slides 2
- File Format PPTX
- Slide Ratio 16:9
- Color
Keywords
- #Content-Based Slides
- #Design-Based Slides
- #Market and Competitor Analysis
- #Diagram
- #Graph
- #Market Analysis
- #Market Overview
- #Table
- #Circles
- #Standard Table
- #Doughnut Chart
- #16:9
- #donut chart PowerPoint slide
- #pie chart template
- #ratio visualization presentation
- #data visualization PPT
- #how to create donut chart in PowerPoint
About the Product
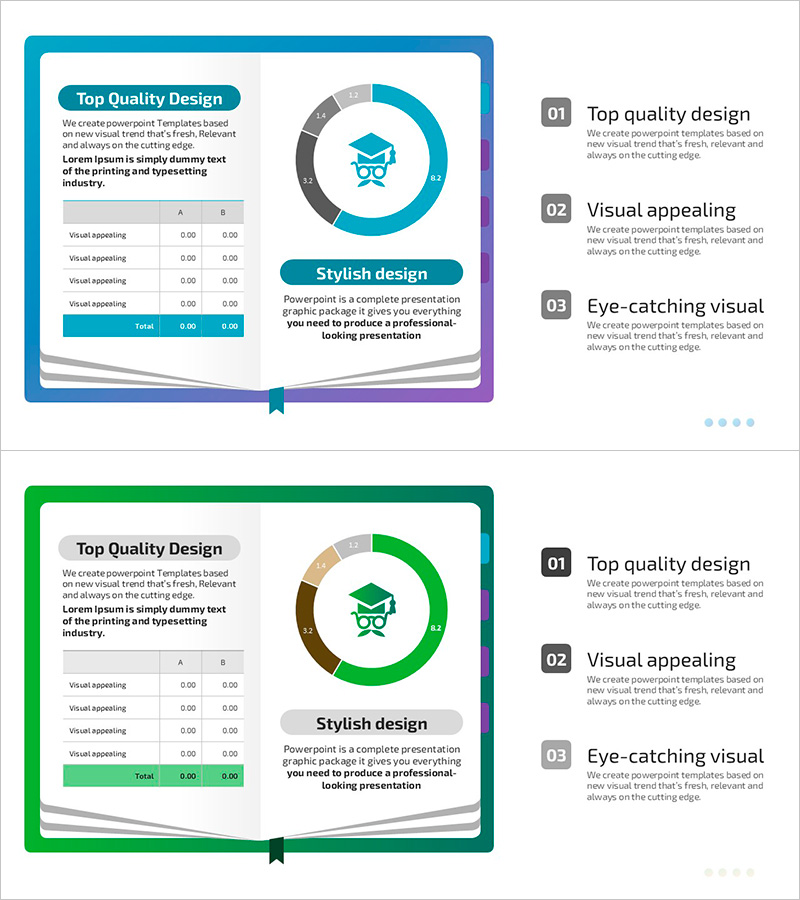
A 2-slide PowerPoint set featuring donut-shaped pie charts in blue and gray tones for intuitive data visualization. The multi-layer donut design effectively displays proportions and composition of complex datasets. The left-side data table automatically updates the chart when you input numerical values, making it instantly applicable to market comparisons, departmental overviews, and product composition analysis. Delivered in 16:9 widescreen PPTX format compatible with all modern PowerPoint versions.
Usage Points
-
Main Usage
Visualize complex data proportions and composition using donut-shaped pie charts to enhance audience comprehension. Effectively communicate market share, budget allocation, customer demographics, and product category revenue by clearly showing the relationship between parts and the whole.
-
How to Use
Input numerical data into the left-side table and the donut chart automatically updates. Customize section colors and labels to match your presentation topic, and combine both slides for multi-level comparative analysis.
-
Recommended For
Executive reports, marketing plans, business analysis presentations, financial status updates, product portfolio introductions, organizational structure explanations, and customer segmentation analysis—ideal for any presentation requiring effective quantitative data communication.
-
Slide Structure
2-slide layout with each slide containing a left-side data input table (4 rows: item name, values A/B/C) and right-side donut pie chart. Center icon and bottom text area for title and description. Blue, gray, and purple gradient tones create visual hierarchy and professional appearance.
Related Products
-

Performance Analysis with Donut Chart and Table
#Market and Competitor Analysis #Diagram #Graph
-

Market Analysis Donut Chart & Table Slide
#Market and Competitor Analysis #Diagram #Graph
-

Industry Trend Analysis Donut Chart – Visual Trends Presentation
#Market and Competitor Analysis #Diagram #Graph
-

Shareholder Status Analysis Donut Pie Chart – Corporate Growth and Competitive Analysis
#Company Introduction #Market and Competitor Analysis #Diagram
