Pie Chart Analysis and Table – Visualizing Market Share
RJ0600038_17
- Last Update 07/01/2025
- File Size 0.2MB
- # of Slides 2
- File Format PPTX
- Slide Ratio 16:9
- Color
Keywords
- #Content-Based Slides
- #Design-Based Slides
- #Market and Competitor Analysis
- #Diagram
- #Graph
- #Market Share
- #Market Analysis
- #Table
- #Circles
- #Pie Chart
- #16:9
- #pie chart PowerPoint slide
- #pie graph template
- #market share visualization
- #data analysis slide
- #percentage breakdown chart
- #business presentation template
About the Product
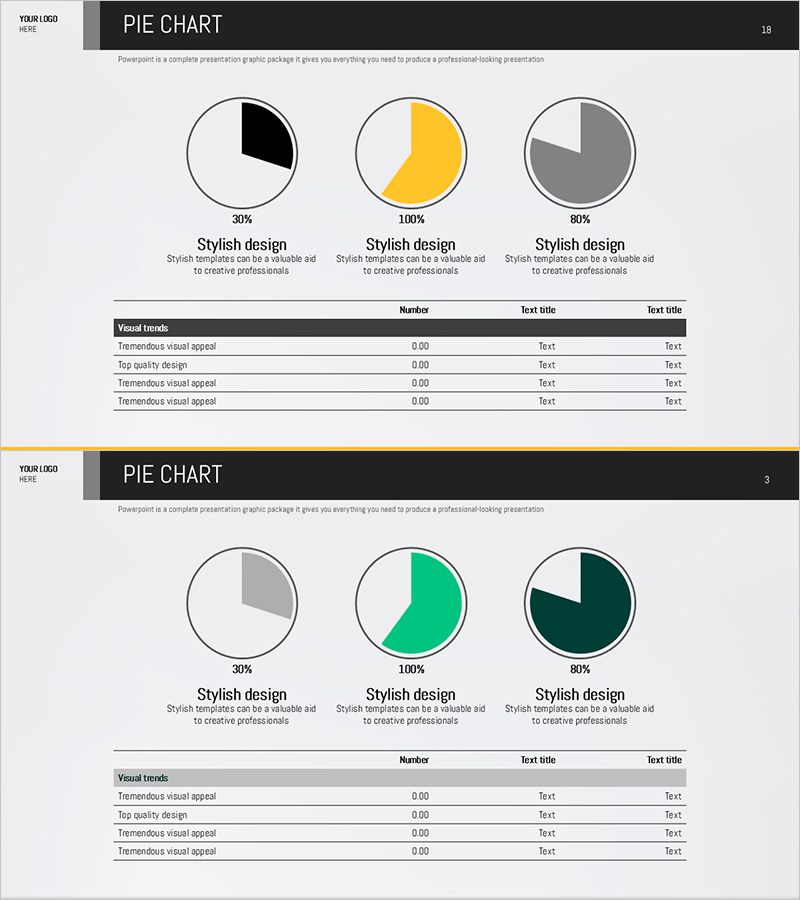
A 2-slide PowerPoint presentation set designed for market share analysis using pie charts. The circular chart features three color segments—black, yellow, and gray—to intuitively represent the proportion of each category. A data table below the chart allows you to organize numerical values and supporting metrics. Created in 16:9 widescreen format, these slides integrate seamlessly into modern presentation environments. Ideal for executive reports, marketing analysis decks, business performance presentations, and competitive landscape reviews where clear visualization of market composition is essential.
Usage Points
-
Main Usage
Visualize market share, revenue composition, customer distribution, and other proportional data using a clear pie chart format. The accompanying data table enables you to present quantitative evidence alongside the visual representation, making it ideal for executive decision-making and stakeholder communication.
-
How to Use
Slide 1 displays a 3-segment pie chart with descriptive text for each category. Slide 2 features the same chart layout with an additional data table below. Simply edit the chart percentages and table entries with your actual data to create a professional, ready-to-present analysis slide.
-
Recommended For
Executive and C-suite presentations of quarterly and annual performance metrics, marketing teams analyzing market trends and competitive positioning, sales teams presenting customer composition data, finance teams explaining revenue breakdown, and consulting firms delivering client analysis reports.
-
Slide Structure
Slide 1: 3-segment pie chart (black 30%, yellow 100%, gray 80%) with category labels and descriptive text. Slide 2: Identical pie chart with a 4-row data table featuring columns for item name, numerical value, and description. 16:9 widescreen format in PPTX with fully editable elements.
Related Products
-

Modern Blue Pie Chart Template – Market Share Analysis
#Market and Competitor Analysis #Diagram #Graph
-

Market Analysis Report Visualized with Pie Chart
#Market and Competitor Analysis #Diagram #Graph
-

Performance Analysis Pie Chart – Market Share Visualization
#Market and Competitor Analysis #Diagram #Graph
-

Market Share Analysis Graph – Effective Market Insights
#Market and Competitor Analysis #Graph #Market Share
