Focus Chart of Subject Proportions – Visualizing Market Share
RB0300038_4
- Last Update 03/11/2025
- File Size 0.4MB
- # of Slides 2
- File Format PPTX
- Slide Ratio 4:3
- Color
Keywords
About the Product
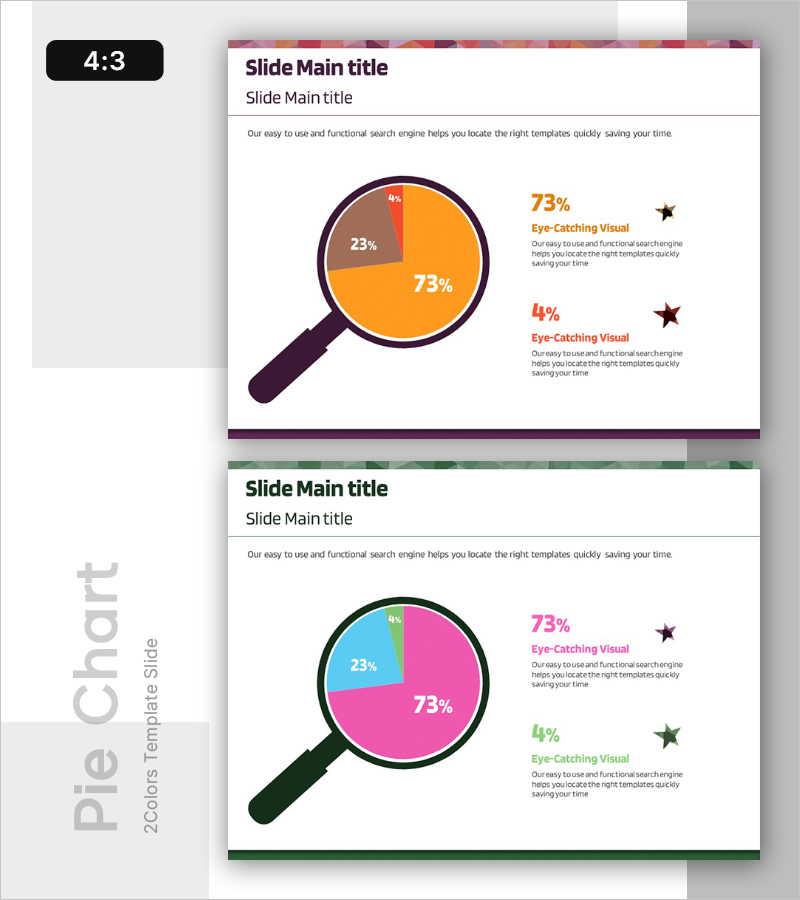
A professional pie chart PowerPoint slide designed to visualize market share and proportion analysis with intuitive clarity. The 3-segment circular graph features warm orange and brown tones paired with a magnifying glass icon, creating a strong visual emphasis on data analysis. The 2-slide set provides identical layouts with two distinct color combinations—orange, brown, and gray versus pink, cyan, and green—allowing flexible selection based on presentation context. Each segment displays percentage values and dedicated text areas for labels, enabling immediate data input and seamless integration into your presentation.
Usage Points
-
Main Usage
Effectively visualizes part-to-whole relationships such as market share, sales distribution, customer composition, and budget allocation. The magnifying glass icon reinforces analytical and investigative intent, making it ideal for marketing reports, business analysis presentations, and investor pitch decks.
-
How to Use
Simply replace the percentage values and labels with your actual data to activate the slide immediately. The magnifying glass position and pie chart dimensions remain fixed, so you can adapt the slide to different presentations through color adjustments and text modifications alone.
-
Recommended For
Marketing professionals, financial analysts, business strategists, and consultants who need to communicate data-driven insights. Particularly valuable for quarterly performance reviews, customer segmentation presentations, and market research findings.
-
Slide Structure
The 2-slide set features identical layouts with contrasting color schemes. Each slide positions a 3-segment pie chart with magnifying glass icon on the left-center, while the right side displays three percentage values and corresponding text description areas. Formatted in 4:3 aspect ratio for universal projector compatibility.
Related Products
-

Market Analysis Report Visualized with Pie Chart
#Market and Competitor Analysis #Diagram #Graph
-

Market Share Circle Graph – Ideal for Market Analysis
#Market and Competitor Analysis #Graph #Market Share
-

Travel Icon Pie Chart Slide - Essential for Market Analysis
#Market and Competitor Analysis #Graph #Market Share
-

Analysis by Pie Chart Item – Visualizing Market Share
#Market and Competitor Analysis #Graph #Market Share
