Horizontal Bar Graph for Product Performance Analysis
RB0800048_5
- Last Update 03/26/2025
- File Size 1.3MB
- # of Slides 2
- File Format PPTX
- Slide Ratio 4:3
- Color
Keywords
- #Content-Based Slides
- #Design-Based Slides
- #Market and Competitor Analysis
- #Financial Plans and Performance
- #Graph
- #Market Status
- #Sales and Revenue
- #Horizontal Bar
- #Horizontal Bar Chart
- #4:3
- #horizontal bar chart PowerPoint
- #bar graph slide template
- #product performance analysis chart
- #data comparison PowerPoint
- #numerical visualization slide
About the Product
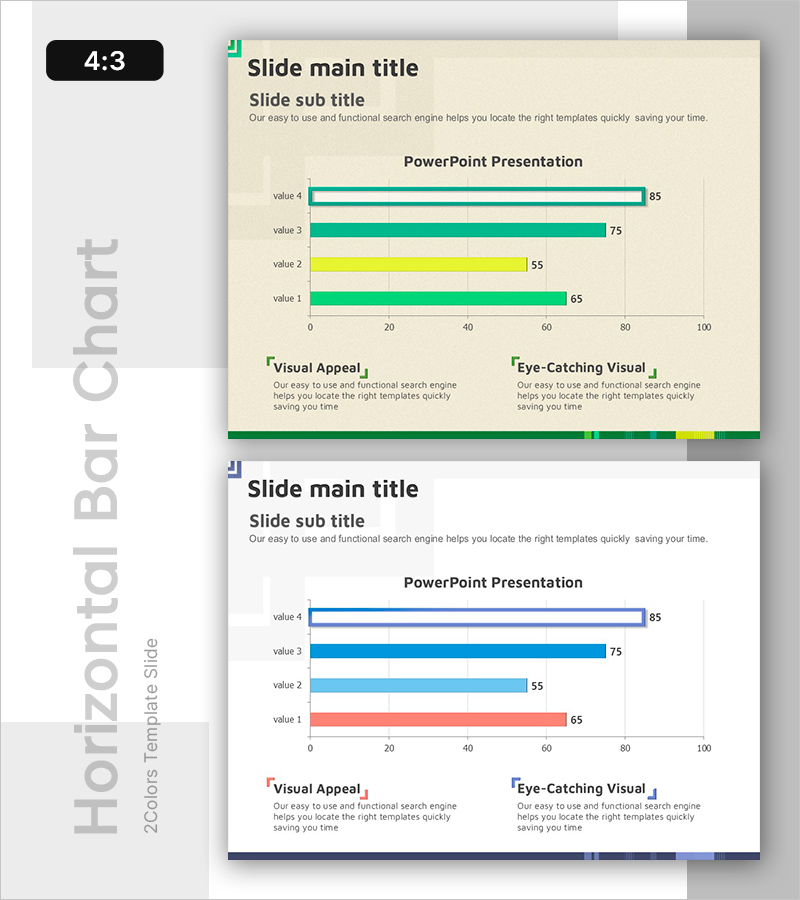
A horizontal bar chart PowerPoint slide designed for product performance analysis with four data items. The slide uses turquoise, yellow, and blue color schemes to differentiate data values (85, 75, 55, 65), making numerical comparisons immediately clear. The 2-slide set includes a color variation version, allowing you to maintain design consistency while offering multiple visual options for your presentation. This slide template is ready to use for any business presentation requiring quantitative data comparison such as sales figures, market share, customer satisfaction scores, or growth metrics.
Usage Points
-
Main Usage
This slide presents quantitative data across four items—such as product performance, sales figures, market share, or customer satisfaction—in a comparative format. The horizontal bar layout enables audiences to instantly grasp the relative magnitude of each data point without requiring detailed explanation.
-
How to Use
Replace the value labels (value 1–4) and numbers (65, 55, 75, 85) with your own data. The turquoise, yellow, and blue color scheme can remain as-is or be customized to match your corporate brand colors. The second slide provides a color variation (blue and pink tones) for presenting the same data in an alternative visual style.
-
Recommended For
Marketing plans, business reports, product presentations, investor pitch decks, quarterly performance reviews, and market analysis documents. Suitable for marketing professionals, sales teams, business analysts, financial officers, and executives who need to present quantitative comparisons.
-
Slide Structure
Four data items (value 1–4) displayed as horizontal bars on a 0–100 scale. Slide 1 uses turquoise, yellow, and blue mixed colors; Slide 2 repeats the same structure with blue and pink tones. Both slides include text boxes labeled 'Visual Appeal' and 'Eye-Catching Visual' at the bottom for additional commentary or key messages.
Related Products
-

Sales Outlook Comparison Analysis Chart – Market Analysis and Performance
#Market and Competitor Analysis #Financial Plans and Performance #Diagram
-

Online Presentation Template – Bilateral Bar Graph
#Market and Competitor Analysis #Financial Plans and Performance #Graph
-

Sports Analysis Bar Chart – Easy Performance Monitoring Option
#Business Strategy #Market and Competitor Analysis #Graph
-

Yellow Blue Line Chart – Market Status and Revenue Analysis
#Market and Competitor Analysis #Financial Plans and Performance #Graph
