Business Plan Presentation Template Bar Diagram Sample
RJ0200027_16
- Last Update 04/05/2025
- File Size 1.9MB
- # of Slides 2
- File Format PPTX
- Slide Ratio 16:9
- Color
Keywords
- #Content-Based Slides
- #Design-Based Slides
- #Market and Competitor Analysis
- #Marketing Plan and Strategy
- #Graph
- #Market Status
- #Marketing Objectives
- #Horizontal Bar
- #Other
- #Horizontal Bar Chart
- #Other Charts
- #16:9
- #bar chart PowerPoint slide
- #dual-series chart template
- #data comparison graph
- #business analysis presentation
- #marketing report slide
About the Product
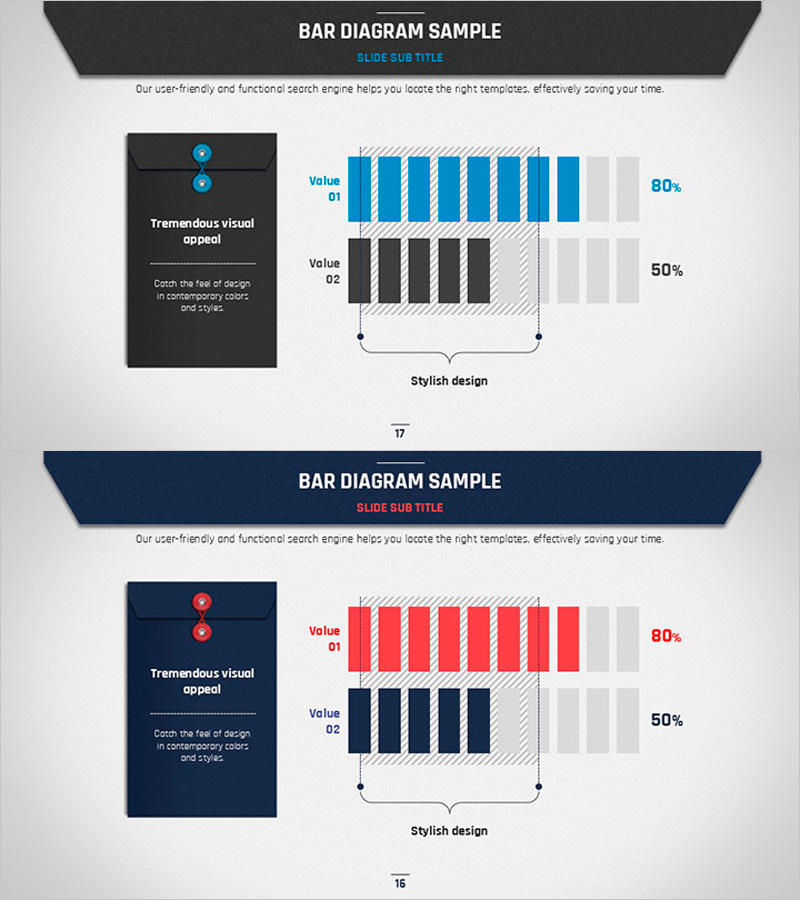
A professional dual-series bar chart PowerPoint slide designed for business presentations and data analysis. The slide features contrasting dark gray and blue bars that visualize two data sets side by side, with percentage values (80%, 50%) clearly displayed for immediate comparison. The left panel includes a text box for key messaging while the right side presents the comparative bar graph, making it ideal for marketing strategy, market analysis, and performance reporting presentations. Delivered as an editable PPTX file in 16:9 widescreen format with 2 slides.
Usage Points
-
Main Usage
Presents two data series side by side using bar charts to enable clear numerical comparison and performance analysis. The layout combines a left-side text box for key messages with a right-side graph for supporting data, creating a persuasive structure for business presentations.
-
How to Use
Use in marketing strategy presentations to compare competitors or market share, or in business reports for quarterly and annual performance comparisons. Simply edit the text box message and update the bar colors and values with your own data for immediate presentation use.
-
Recommended For
Marketing professionals, business analysts, and executives presenting performance metrics, market research results, or budget comparisons. Particularly effective when comparing two key indicators where relative size differences need clear visual emphasis.
-
Slide Structure
Two-slide set with dark gray and blue header themes. Each slide contains a left text box for key messaging and a right dual-series bar graph (Value 01 and Value 02, each with 5-9 items). Percentage indicators (80%, 50%) and gray background areas clearly define comparison ranges and data hierarchy.
Related Products
-

Eco-friendly Horizontal Bar Graph for Market Overview
#Market and Competitor Analysis #Graph #Market Status
-

Triangular Prism Graph for Visualizing Market Status – Insights and Analysis
#Market and Competitor Analysis #Graph #Other
-

Idea Derivation Bar Chart Template – Market and Competitor Analysis
#Market and Competitor Analysis #Marketing Plan and Strategy #Graph
-

Sports Analysis Bar Chart – Easy Performance Monitoring Option
#Business Strategy #Market and Competitor Analysis #Graph
