A Cyclical Process for Continuous Improvement
RB0800048_10
- Last Update 03/26/2025
- File Size 1.3MB
- # of Slides 2
- File Format PPTX
- Slide Ratio 4:3
- Color
Keywords
- #Content-Based Slides
- #Design-Based Slides
- #Operational Plan
- #Technical Approach
- #Diagram
- #Business Processes
- #Service Implementation Plan
- #Flow
- #Circular Flow
- #4:3
- #circular diagram PowerPoint
- #2-stage cycle slide
- #continuous improvement presentation
- #process flow diagram
- #bidirectional arrow slide
About the Product
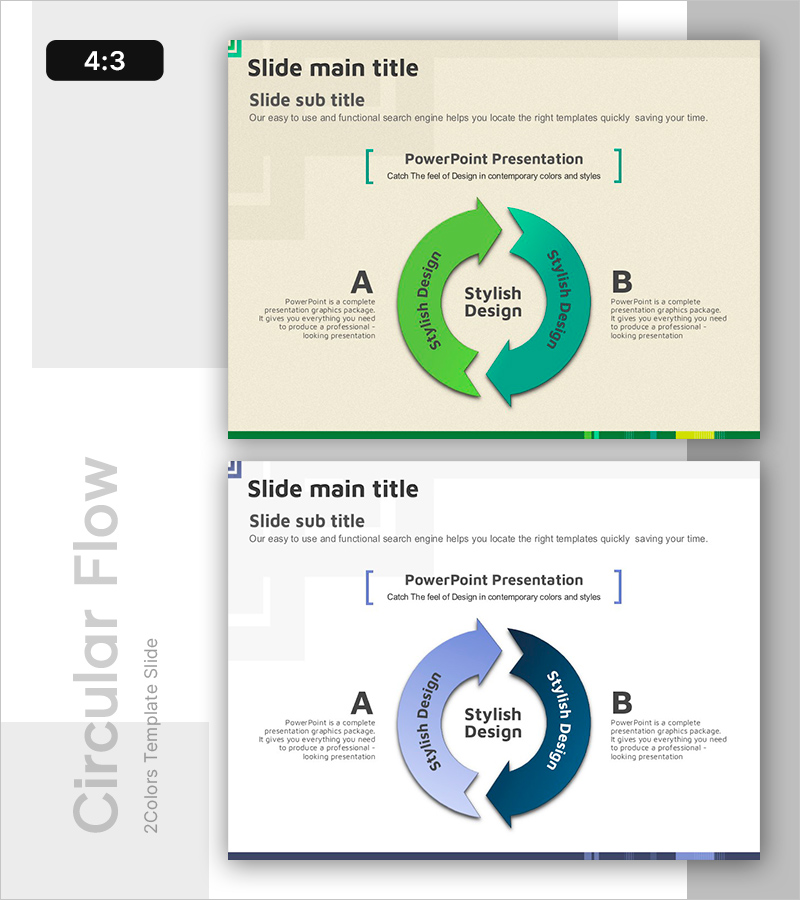
A 2-stage circular diagram PowerPoint slide designed to visualize continuous improvement processes and cyclical workflows. Green and teal arrows represent bidirectional flow, with a central message area and left-right text boxes for detailed explanations. This 4:3 aspect ratio, 2-slide set is ready to use for operational planning, business process documentation, and service implementation presentations. Ideal for emphasizing cycle flow, continuous improvement, and two-way process dynamics in your PowerPoint presentation.
Usage Points
-
Main Usage
Effectively visualizes continuous improvement, cyclical processes, and bidirectional workflows. The central message area anchors the concept while left and right arrows represent sequential stages connected in a cycle. Perfect for operational planning, business process documentation, and service implementation strategies requiring iterative improvement messaging.
-
How to Use
Enter your core concept in the central text area (e.g., Stylish Design) and add stage descriptions in the left and right arrow sections. Colors can remain as designed or be customized to match your corporate branding. The 2-slide format allows you to present multiple cyclical processes in sequence.
-
Recommended For
Operations, technology, and marketing teams presenting process improvement initiatives; quality management reports; service improvement strategy meetings; team workflow explanations; sustainability and circular economy presentations. Effective for sharing processes with executives, team members, and external partners.
-
Slide Structure
2-stage circular diagram with a central circular text box for the core message, left green arrow (Stage A), and right teal arrow (Stage B) connected bidirectionally. Text can be added within each arrow, with additional explanation areas below left and right sections. 4:3 aspect ratio across 2 slides.
Related Products
-

Air Operation Process – Understanding Operational Plans Through Diagrams
#Operational Plan #Technical Approach #Diagram
-

Safety Management System Process Slide – Efficient Operation and Management
#Operational Plan #Technical Approach #Diagram
-

Circular Process Diagram – Designing Efficient Workflows
#Operational Plan #Technical Approach #Diagram
-

Medical Circulatory System Diagram Slide
#Operational Plan #Technical Approach #Diagram
