In-Depth Analysis Based on 70% Donut Chart – Insightful Market Share Insights
RB0800047_8
- Last Update 03/26/2025
- File Size 0.2MB
- # of Slides 2
- File Format PPTX
- Slide Ratio 4:3
- Color
Keywords
- #Content-Based Slides
- #Design-Based Slides
- #Market and Competitor Analysis
- #Financial Plans and Performance
- #Graph
- #Market Share
- #Projected Return on Investment (ROI)
- #Circles
- #Doughnut Chart
- #4:3
- #donut chart PowerPoint slide
- #pie chart template download
- #market share analysis PowerPoint
- #percentage visualization slides
- #financial data presentation template
About the Product
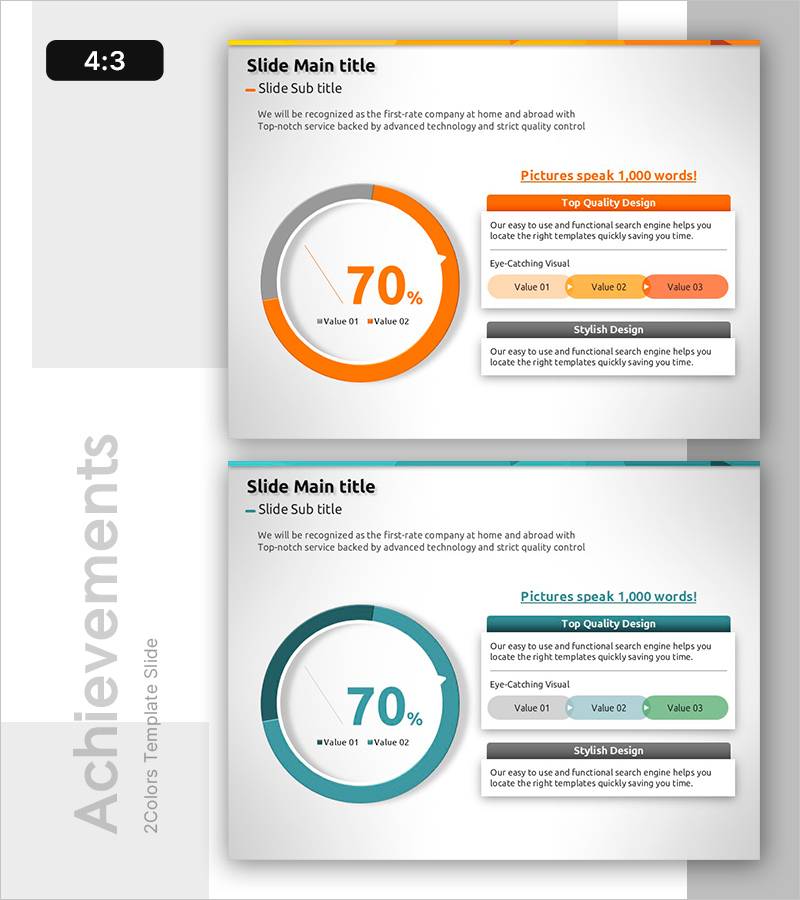
A donut chart PowerPoint slide designed to visualize market share and financial data with precision. The two-color gradient design in orange and gray emphasizes the 70% key metric while maintaining visual balance. The right-side information panel features 'Top Quality Design' and 'Stylish Design' sections with three value buttons for detailed insights. This 4:3 ratio, 2-slide template is ready to use in business reports, marketing plans, and investor presentations.
Usage Points
-
Main Usage
Visualizes part-to-whole ratios such as market share, revenue distribution, and customer composition. The 70% emphasis with supporting 30% segment clearly communicates key metrics and comparative data.
-
How to Use
Insert into the financial section of business reports, market analysis pages of marketing plans, or competitive analysis slides of investor pitch decks. Add detailed explanations or insights in the right-side text panel to enhance graph interpretation.
-
Recommended For
Finance managers, marketing strategists, executive report presenters, and investor relations professionals presenting data-driven decisions. Ideal for quarterly performance analysis and market entry strategy presentations.
-
Slide Structure
Donut chart (70% orange, 30% gray) paired with right-side information area. Title and subtitle at top, centered graph, 'Top Quality Design' header with three value buttons (Value 01–03), and 'Stylish Design' section below, repeated across 2 slides.
Related Products
-

Donut Charts of Animals and Plants – Effective Market Analysis Tool
#Business Strategy #Market and Competitor Analysis #Diagram
-

Animals Nature Donut Chart Infographics – Market Share Analysis
#Market and Competitor Analysis #Graph #Market Share
-

Analysis of Customer Preference for Eco-Friendly Business Donut Chart
#Market and Competitor Analysis #Diagram #Graph
-

Market Share Analysis with Donut Charts – Squirrels Theme
#Market and Competitor Analysis #Graph #Market Share
