Trick Development Status Chart – Strategic Insights through Data Visualization
RJ0600042_8
- Last Update 07/02/2025
- File Size 0.4MB
- # of Slides 2
- File Format PPTX
- Slide Ratio 16:9
- Color
Keywords
- #Content-Based Slides
- #Design-Based Slides
- #Product/Service Introduction
- #Market and Competitor Analysis
- #Graph
- #Development Status
- #Market Share
- #Circles
- #Doughnut Chart
- #16:9
- #donut chart PowerPoint
- #pie chart slide template
- #circular graph presentation
- #ratio data visualization
- #donut graph PPT download
About the Product
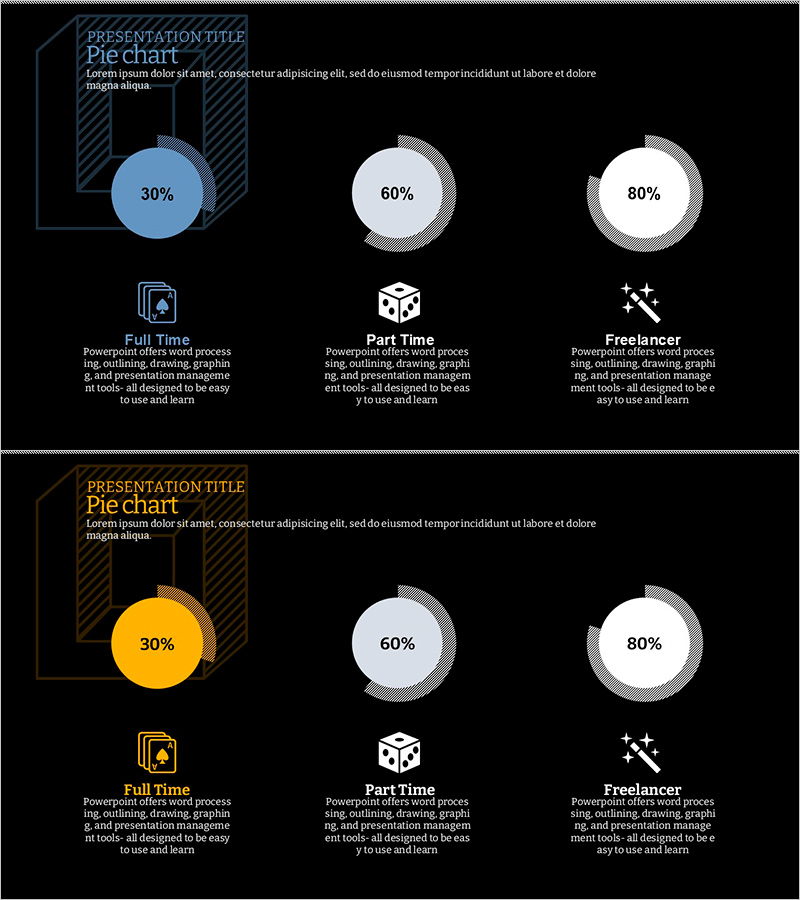
A PowerPoint slide featuring three donut-shaped pie charts displaying proportional data across three categories. The charts showcase 30%, 60%, and 80% values in blue, gray, and white tones respectively. The left side includes a presentation title area and descriptive text, while the right side displays category icons (Full Time, Part Time, Freelancer) with accompanying explanations. This 2-slide template is optimized for 16:9 widescreen format and is ready for immediate use in market share analysis, project status reports, workforce composition presentations, and strategic data visualization.
Usage Points
-
Main Usage
Visualizes three or more data segments using donut-shaped pie charts for immediate comprehension of data composition. Effectively communicates market share, project development status, workforce distribution, customer satisfaction metrics, and other ratio-based information. Each donut chart is independently editable, allowing flexible adaptation to various datasets.
-
How to Use
Enter your presentation title in the left title area and modify the chart percentages and labels to match your data. Update the category icons and descriptive text to reflect your specific categories. Colors can be adjusted to match corporate branding guidelines. Reuse the 2-slide template to present multiple data sets throughout your presentation.
-
Recommended For
Recommended for executive reports, business status presentations, marketing analysis materials, HR performance reviews, and financial analysis presentations. Ideal for executives, team leads, project managers, marketing professionals, and financial analysts who need data-driven decision-making visuals.
-
Slide Structure
Both slides feature identical layout: title area (PRESENTATION TITLE) in upper left, three donut pie charts (displaying 30%, 60%, 80%) in center, and category icons (Full Time, Part Time, Freelancer) with descriptive text at bottom. 16:9 widescreen format with black background and blue, gray, and white donut chart segments.
Related Products
-

Analysis of Transportation Usage Status – Pie Chart
#Product/Service Introduction #Market and Competitor Analysis #Graph
-

Financial Business Analysis Pie Chart – Market Share Insights
#Product/Service Introduction #Market and Competitor Analysis #Graph
-

Analysis graph of market share progress
#Product/Service Introduction #Market and Competitor Analysis #Graph
-

Development Status Analysis Donut Chart – Market Share Visualization
#Product/Service Introduction #Market and Competitor Analysis #Graph
