Visualization of War Equipment Penetration Rate – Market Share Analysis
RJ0600056_9
- Last Update 07/05/2025
- File Size 2.8MB
- # of Slides 2
- File Format PPTX
- Slide Ratio 16:9
- Color
Keywords
- #Content-Based Slides
- #Design-Based Slides
- #Market and Competitor Analysis
- #Graph
- #Market Share
- #Competitive Advantage
- #Circles
- #Doughnut Chart
- #16:9
- #doughnut chart PowerPoint
- #pie chart slide template
- #ratio comparison graph
- #donut chart template download
- #2-segment pie chart
- #competitive analysis PowerPoint slide
About the Product
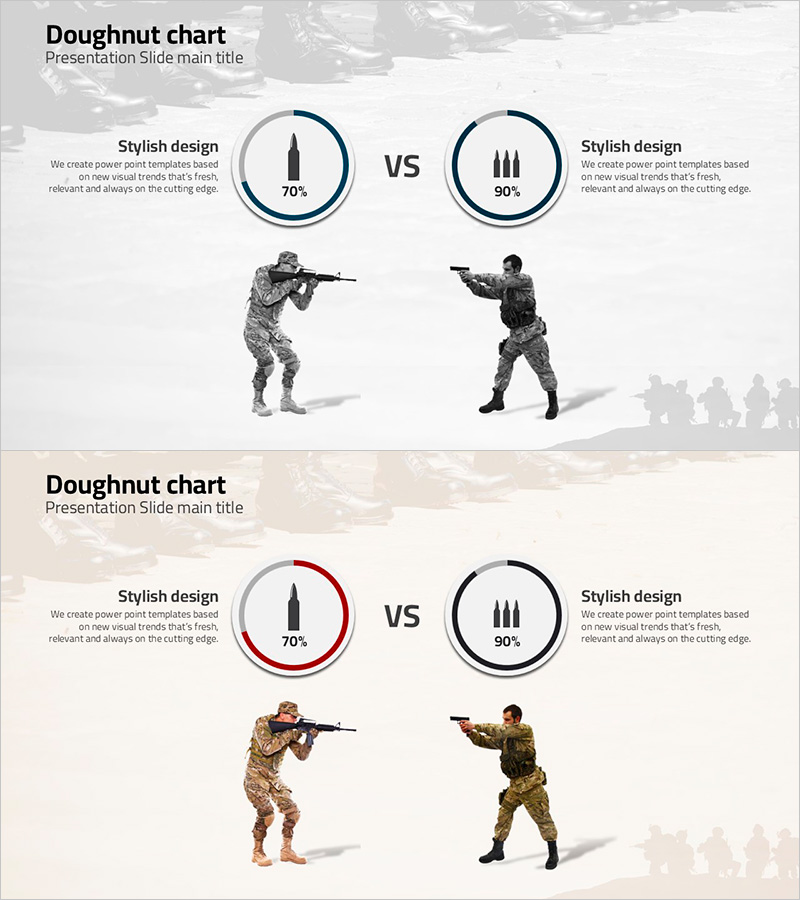
A PowerPoint slide template featuring two doughnut charts for visualizing ratio comparisons between two items. The charts are arranged symmetrically with dark blue and red border accents, making them ideal for competitive analysis and market share visualization. Each chart includes a silhouette image and text area below for clear labeling of comparison subjects. This 2-slide set is ready to use immediately, with fully editable numbers and labels in PowerPoint.
Usage Points
-
Main Usage
Clearly compare and analyze the ratio difference between two items using doughnut chart visualization. Optimized for presenting market share, penetration rates, competitive comparisons, and performance metrics with symmetrical layout for balanced visual impact.
-
How to Use
Use in business reports, marketing analysis presentations, and management briefings to explain competitive situations or market conditions. Edit the numerical values in each doughnut chart and add comparison labels and descriptions in the text areas below. Silhouette images can be customized to match your topic.
-
Recommended For
Recommended for executives, marketing professionals, consultants, and analysts presenting competitive analysis, market research findings, and performance comparisons. Highly effective in manufacturing, retail, and IT company board meetings, investor presentations, and strategic planning sessions.
-
Slide Structure
2-slide set with two doughnut charts arranged horizontally on each slide. Each chart features a dark border accent with numerical display in the center, silhouette image, and text description area below. Formatted in 16:9 widescreen ratio for modern presentation environments.
Related Products
-

Sensuous Doughnut Chart Slide – Market Share Analysis
#Market and Competitor Analysis #Diagram #Graph
-

Fashion Design Comparative Donut Chart – Market Share Analysis
#Market and Competitor Analysis #Graph #Market Share
-

Purple Brown Competitive Advantage Donut Graph – Visualizing Market Share
#Market and Competitor Analysis #Graph #Market Share
-

Circle Donut Market Share Graph – Visual Elements for Market Analysis
#Market and Competitor Analysis #Graph #Market Share
