Sky Blue Horizontal Bar Chart – Insights Through Visualization
RB0800045_5
- Last Update 03/25/2025
- File Size 0.2MB
- # of Slides 2
- File Format PPTX
- Slide Ratio 4:3
- Color
Keywords
About the Product
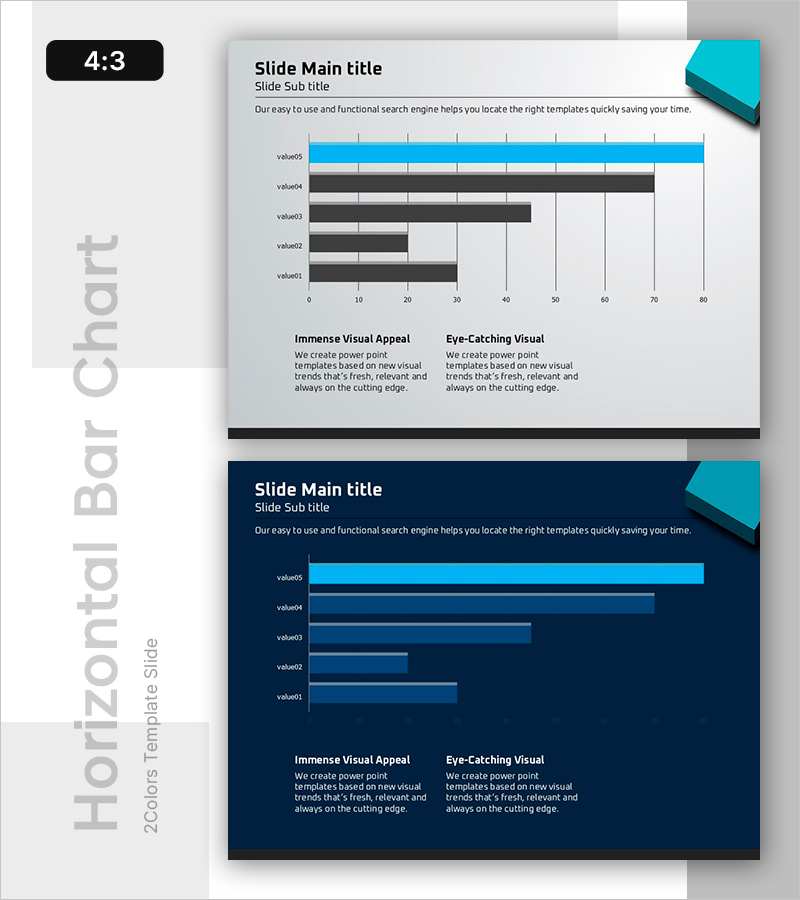
A PowerPoint slide featuring a horizontal bar chart comparing five data values with cyan as the primary accent color and black and gray as supporting series. The 2-slide set includes both light and dark background versions, allowing you to match your presentation environment and document tone. Each bar is scaled against a 0–80 axis, making it ideal for displaying sales performance, departmental results, market share, or any quantitative comparison. The layout clearly prioritizes the leading metric while maintaining visual balance across all five categories.
Usage Points
-
Main Usage
Display quantitative data through bar length comparison, enabling audiences to instantly grasp differences in magnitude and ranking. Ideal for presenting sales figures, customer counts, market share, departmental performance, product satisfaction scores, or any metric requiring side-by-side numerical comparison across five or more categories.
-
How to Use
Adjust each bar length to match your actual data values and replace the placeholder labels (value01–value05) with your category names. Use the light background version for standard meeting rooms and online presentations; choose the dark background for low-light environments, video recording, or projection scenarios. Update only the data while preserving the color scheme for immediate deployment.
-
Recommended For
Sales and marketing performance reports, executive-level results presentations, consulting proposal benchmarking, academic research data comparison, investor pitch decks analyzing market trends, and quarterly business reviews. Particularly effective when comparing 5–10 ranked items or performance metrics across departments or product lines.
-
Slide Structure
Each slide contains a title and subtitle area, five horizontal bars (one cyan primary series plus two to three supporting black and gray series), a 0–80 horizontal axis with gridlines, and two descriptive text boxes at the bottom (Immense Visual Appeal and Eye-Catching Visual). Two complete layouts provided: light gray background and navy dark background versions.
Related Products
-

Travel Guide Industry Market Share Pie Chart
#Market and Competitor Analysis #Graph #Market Status
-

Analysis of Changes in Avocado Purchases with Horizontal and Vertical Bar Graphs
#Market and Competitor Analysis #Graph #Market Status
-

Sales Status by Donut Product Visualization – Attractive Graph Design
#Product/Service Introduction #Market and Competitor Analysis #Graph
-

Data Insights Enhanced by Highlighted Metrics
#Market and Competitor Analysis #Graph #Other
