Development Status Analysis Pie & Bar Chart – Market Share Visualization
RM0100002_11
- Last Update 01/24/2025
- File Size 0.4MB
- # of Slides 4
- File Format PPTX
- Slide Ratio 16:9
- Color
Keywords
- #Content-Based Slides
- #Design-Based Slides
- #Product/Service Introduction
- #Market and Competitor Analysis
- #Graph
- #Development Status
- #Market Share
- #Horizontal Bar
- #Circles
- #Segmented Horizontal Bar
- #Pie Chart
- #16:9
- #pie chart PowerPoint slide
- #bar graph presentation template
- #market share visualization
- #circular chart slide
- #data visualization PowerPoint
- #comparative analysis slide
About the Product
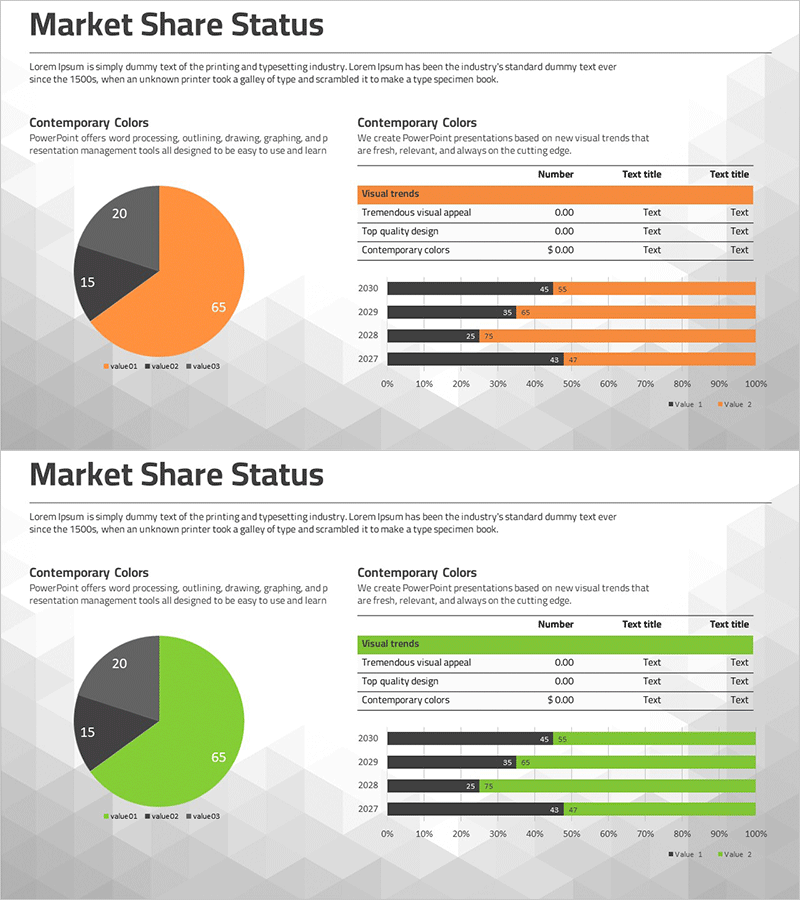
A comprehensive PowerPoint slide combining pie chart and horizontal bar graph to analyze market share and development status simultaneously. The circular chart visualizes overall composition ratios while the bar graph displays year-over-year trends. Orange, black, and gray tones create clear data hierarchy, with an integrated data table for detailed information. This presentation template effectively communicates numerical insights in business reports, strategic plans, and analytical presentations.
Usage Points
-
Main Usage
Designed to analyze and compare complex datasets such as market share, development progress, and sales ratios from multiple perspectives on a single slide. The pie chart provides overall composition understanding while the bar graph shows temporal trends, enhancing audience comprehension.
-
How to Use
Ideal for executive reports, business plan presentations, marketing analysis materials, and quarterly performance reviews where data-driven insights must be communicated. Clear legends and data labels enable immediate editing and deployment.
-
Recommended For
Recommended for finance teams, marketing departments, strategic planning units, sales managers, and executive presentations. Particularly suitable for quarterly performance comparisons, market analysis, competitive benchmarking, and portfolio presentations requiring credible data representation.
-
Slide Structure
Left-aligned pie chart (3 or 4 segments) showing composition ratios, upper-right data table with legend and numerical values, lower-right horizontal bar graph (4 years × 2 data series) in two-tier layout. Orange, black, gray, and white contrast establishes clear information hierarchy.
Related Products
-

Medical Development Status Pie Chart – Visualizing Market Share
#Product/Service Introduction #Market and Competitor Analysis #Graph
-

Red Green Detail Analysis Chart – Visualizing Market Share
#Market and Competitor Analysis #Graph #Market Status
-

Graph Ratio by Subject – Education Market Analysis
#Market and Competitor Analysis #Graph #Market Share
-

Development Status Pie Chart – Efficient Data Delivery
#Product/Service Introduction #Market and Competitor Analysis #Graph
