Radial Charts in the Architectural Sector - Innovative Customer Analysis
RJ0900004_23
- Last Update 08/16/2025
- File Size 0.4MB
- # of Slides 2
- File Format PPTX
- Slide Ratio 16:9
- Color
Keywords
- #Content-Based Slides
- #Design-Based Slides
- #Market and Competitor Analysis
- #Graph
- #Customer Analysis
- #Market Analysis
- #Other
- #Radar Chart Spider Chart
- #16:9
- #radial chart PowerPoint
- #5-axis comparison slide
- #PowerPoint diagram template
- #customer analysis chart
- #competitive analysis PPT
- #radial diagram PowerPoint slide
About the Product
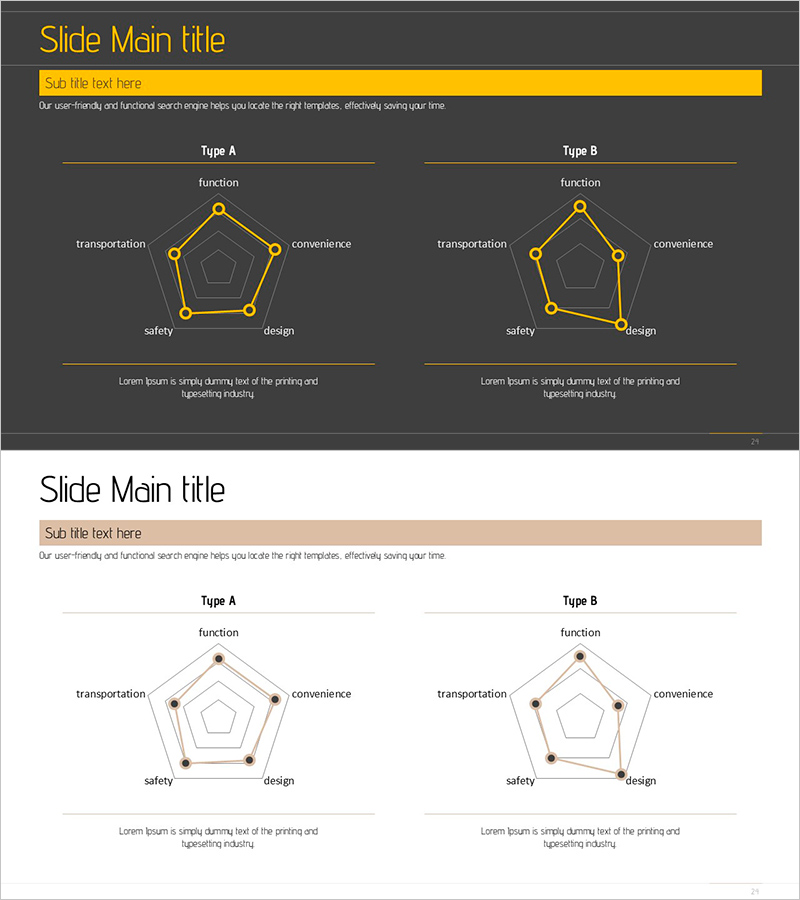
A 5-axis radial chart PowerPoint slide designed for multi-dimensional evaluation in architecture and business sectors. The structure radiates from a central hub to five axes, enabling simultaneous comparison of function, transportation, convenience, safety, and design metrics. Gold-toned nodes and connecting lines stand out against the dark background, with Type A and Type B variations allowing flexible data emphasis. Ideal for customer analysis, competitive benchmarking, and market positioning presentations where complex multi-factor data requires intuitive visual representation.
Usage Points
-
Main Usage
Multi-dimensional data visualization radiating from a central point to five evaluation axes. Effectively compares customer satisfaction, product characteristics, competitor positioning, and market analysis across five or more metrics simultaneously. Axis length visually represents numerical differences and performance gaps.
-
How to Use
Deploy in strategy and market analysis sections for customer needs assessment, competitive benchmarking, and product positioning. Select Type A for balanced 5-metric display or Type B to emphasize specific factors. Adjust node positions and line lengths to reflect actual data values and relationships.
-
Recommended For
Architecture, real estate, and manufacturing companies analyzing product features. Consulting firms presenting customer analysis reports. Marketing teams developing market positioning strategies. Executive presentations requiring competitive landscape analysis. Ideal for B2B presentations comparing five or more evaluation dimensions.
-
Slide Structure
2-slide set. Each slide features two 5-axis radial charts centered on the slide. Pentagon-shaped diagrams with gold nodes (●) and connecting lines radiating from center hub. Five labeled axes: function, transportation, convenience, safety, design. Dark background with gold accent colors. 16:9 widescreen format.
Related Products
-

Four Color Infographic Presentation Template Radar Graph
#Market and Competitor Analysis #Graph #Customer Analysis
-

Online Shopping Mall System Radial Graph – Dynamic Data Visualization
#Business Introduction #Market and Competitor Analysis #Graph
-

Analysis Before and After Diet – Change and Achievement
#Product/Service Introduction #Market and Competitor Analysis #Graph
-

Analysis of the Gender Ratio of Users of Self-Driving Services – Market Analysis and Customer Insight
#Market and Competitor Analysis #Customer Analysis #Market Analysis
