Milestones in Strategic Growth – Company Timeline Diagram
RB0800044_4
- Last Update 03/25/2025
- File Size 5.6MB
- # of Slides 2
- File Format PPTX
- Slide Ratio 4:3
- Color
Keywords
About the Product
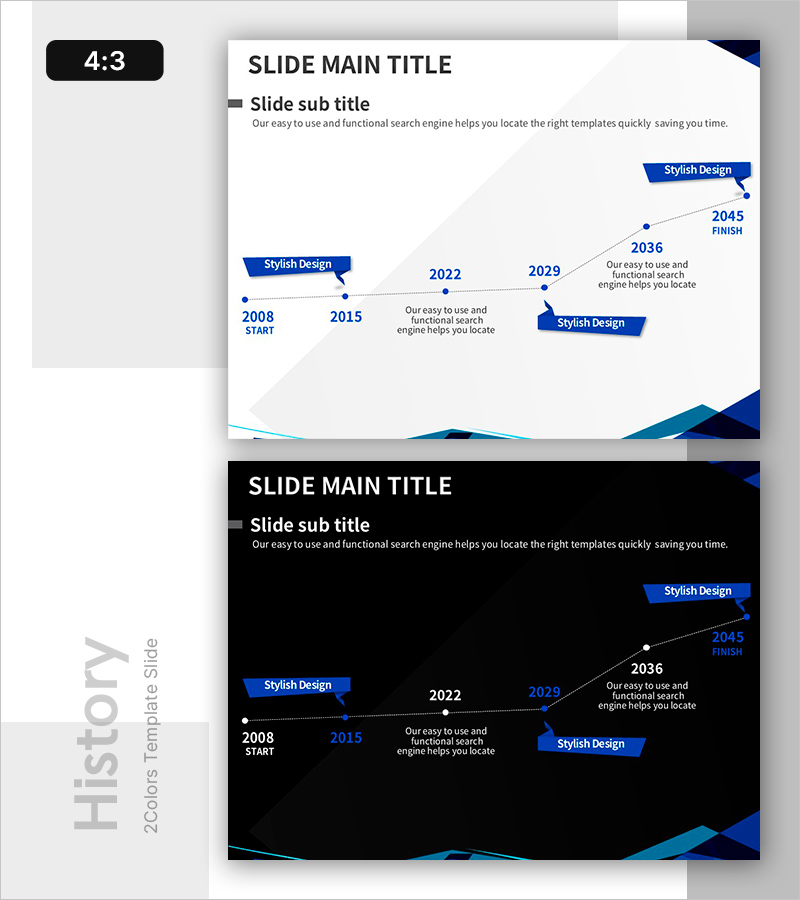
A 6-stage timeline diagram PowerPoint slide that visualizes your company's growth journey from 2008 START to 2045 FINISH. Each milestone is clearly marked with blue accent boxes and white typography, connected by dotted lines for seamless flow. The slide includes speech bubble callouts for adding detailed descriptions at each stage, making it ideal for company history presentations, strategic growth narratives, and project milestone tracking. Provided in 4:3 aspect ratio with 2 slides featuring both light and dark background versions for flexible presentation environments.
Usage Points
-
Main Usage
Effectively communicate your organization's historical development and key achievements through a visual timeline format. Perfect for investor presentations, company introductions, annual reports, and strategic growth narratives where chronological storytelling is essential.
-
How to Use
Enter years and milestone events in each stage node, then add detailed descriptions in the speech bubble callouts. Choose between light background for bright venues or dark background for modern presentation settings. Fully editable colors and text to match your brand identity and corporate guidelines.
-
Recommended For
Company overview presentations, annual reports, investor pitch decks, executive briefings, organizational history timelines, marketing strategy presentations. Ideal for CEOs, marketing managers, investor relations professionals, and corporate communications teams.
-
Slide Structure
Linear timeline with 6 connected nodes (2008 START, 2015, 2022, 2029, 2036, 2045 FINISH) linked by dotted connector lines. Blue speech bubble callouts positioned above each milestone for contextual information. Dual-version design with light and dark background options.
Related Products
-

Company History Mini Diagram – Clear and Concise Timeline
#Company Introduction #Diagram #History
-

Fountain Pen History Diagram – Emphasizing Corporate Identity
#Company Introduction #Product/Service Introduction #Diagram
-

History Road Diagram – A Cluster Diagram Ideal for Company Introduction
#Company Introduction #Diagram #History
-

Spade Shape Theme History Diagram – Emphasizing Company Development
#Company Introduction #Diagram #History
