Business History Diagram – Visualizing Organizational Growth
RJ0300062_4
- Last Update 05/05/2025
- File Size 1.3MB
- # of Slides 2
- File Format PPTX
- Slide Ratio 16:9
- Color
Keywords
- #Content-Based Slides
- #Design-Based Slides
- #Company Introduction
- #Diagram
- #History
- #Cluster
- #Chain Diagram
- #16:9
- #business history timeline diagram
- #company milestone PowerPoint slide
- #organizational growth visualization
- #connected timeline template
- #corporate history presentation
- #how to create timeline diagram in PowerPoint
About the Product
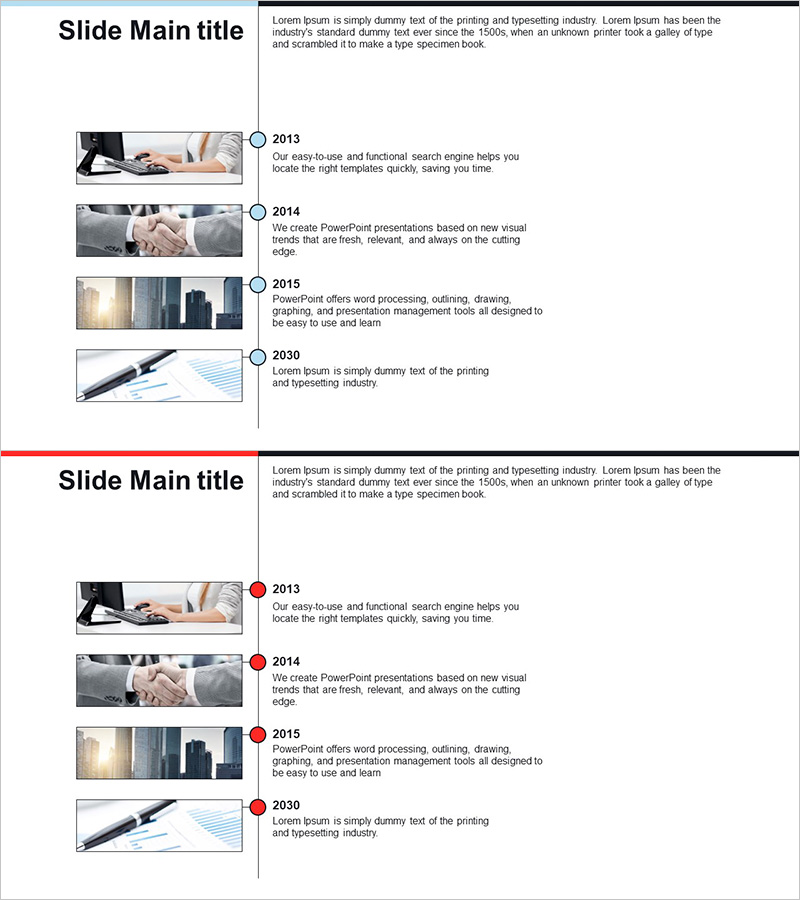
A connected-node timeline diagram PowerPoint slide that visualizes organizational development across four chronological stages. This slide combines left-aligned images with right-aligned text descriptions, creating a clear visual narrative of company milestones and achievements. The circular nodes connected by a vertical timeline intuitively convey the flow of company history, making it ideal for business presentations and corporate profile decks. The layout effectively communicates organizational growth trajectory and historical significance. Delivered as 2 slides in 16:9 widescreen format, fully editable in PPTX.
Usage Points
-
Main Usage
Present your organization's journey from founding to present day by arranging key milestones and achievements chronologically. This diagram strengthens credibility and demonstrates organizational experience during company introduction and corporate profile sections.
-
How to Use
Enter years or dates in the circular nodes and add corresponding achievements, events, or milestones in the text areas on the right. Insert representative photos or product images in the left image zones to enhance visual impact and storytelling.
-
Recommended For
Ideal for company profile presentations, corporate introductions, investor pitch decks, employee onboarding materials, and corporate promotional presentations. Best suited for established organizations with four or more significant historical milestones to showcase.
-
Slide Structure
2-slide set featuring 4 connected circular nodes arranged vertically with a timeline connector. Each slide includes 4 image zones on the left and 4 corresponding text description areas on the right, with connecting lines emphasizing chronological progression.
Related Products
-

Business Connection Diagram – Cluster and History
#Company Introduction #Diagram #Company Overview
-

Company History Mini Diagram – Clear and Concise Timeline
#Company Introduction #Diagram #History
-

History Road Diagram – A Cluster Diagram Ideal for Company Introduction
#Company Introduction #Diagram #History
-

Introduction to the History of the Architectural Company – A Visual Timeline
#Company Introduction #Diagram #Company Overview
