Portfolio Profile Slide – Company Timeline and Cluster
RJ0300041_5
- Last Update 04/28/2025
- File Size 2.1MB
- # of Slides 2
- File Format PPTX
- Slide Ratio 16:9
- Color
Keywords
- #Content-Based Slides
- #Design-Based Slides
- #Company Introduction
- #Diagram
- #History
- #Cluster
- #Table
- #Chain Diagram
- #Standard Table
- #Horizontal Table
- #16:9
- #timeline diagram PowerPoint
- #company history slide template
- #4-stage linear diagram
- #portfolio profile PowerPoint
- #corporate milestone presentation slide
About the Product
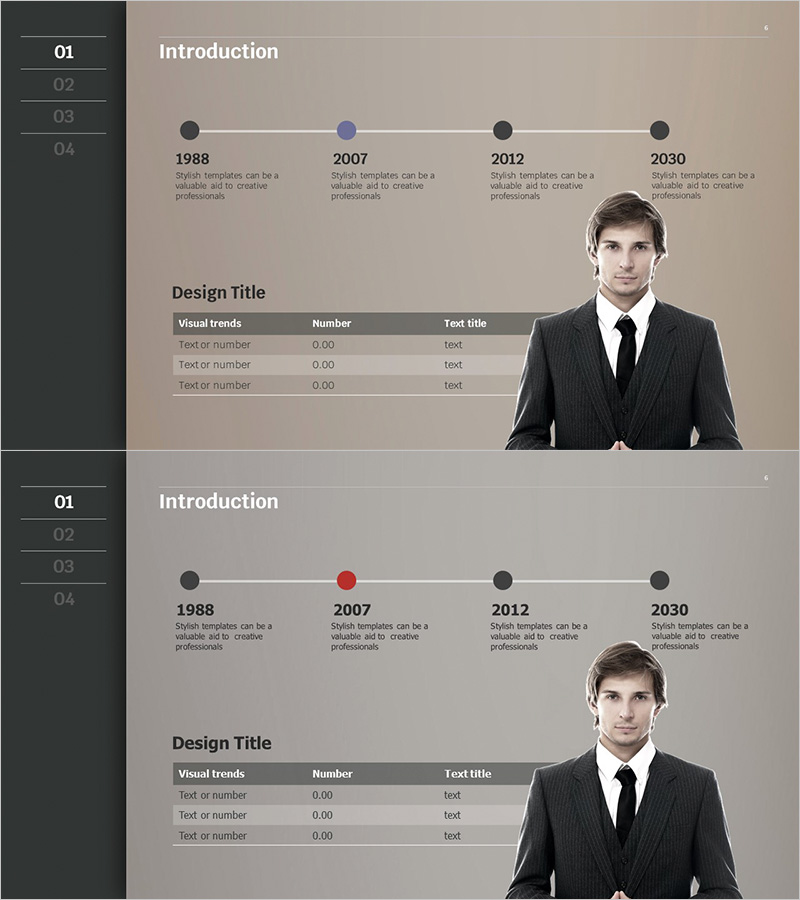
A 4-stage timeline diagram PowerPoint slide designed to visualize company milestones and corporate history from 1988 to 2030. The horizontal linear diagram features four emphasis nodes in blue, black, and gray tones, each marking a critical milestone year. A 3-row data table below the timeline displays visual trends, numerical metrics, and descriptive text for each period. The layout includes a professional business profile photo positioned on the right, making it ideal for company introductions, portfolio presentations, and annual reports. Delivered in 16:9 widescreen format, PPTX file type, 2-slide set with fully editable shapes, text fields, and color-coded nodes for customization.
Usage Points
-
Main Usage
Clearly communicate major growth phases and corporate milestones in chronological order. Four nodes highlight key years and achievements, while the data table below presents quantitative metrics (revenue, headcount, business initiatives) for each period, building credibility and organizational narrative.
-
How to Use
Place this slide as the first or second slide in the company introduction section to quickly establish organizational history and trustworthiness. Edit node text and colors to emphasize specific periods, and update table data with actual figures to strengthen persuasiveness and relevance to your audience.
-
Recommended For
Ideal for company introductions, portfolio presentations, annual reports, investor pitch decks, and corporate profile speeches. Particularly effective for startups, mid-size enterprises, and large corporations presenting sustained growth to executives, investors, and job candidates.
-
Slide Structure
Slide 1: Left navigation bar (sections 01–04) + center title 'Introduction' + 4-node horizontal timeline (1988, 2007, 2012, 2030) + descriptive text below each node + 3-row data table (Visual trends, Number, Text title) + right-side business profile photo. Slide 2: Same layout with repositioned emphasis node (2007 highlighted in blue) and restructured table data for alternative narrative.
Related Products
-

Business History Diagram – Cluster Visualization
#Company Introduction #Diagram #History
-

Simple Theme History Diagram – Visualizing Company History
#Company Introduction #Diagram #History
-

History Flag Shape Diagram - Company Growth and Vision
#Company Introduction #Diagram #History
-

History Connection Diagram – Visualizing Historical Flow
#Company Introduction #Diagram #History
