Silverbox Template Table Chart – Effectively Communicate Business Performance
RB0800043_9
- Last Update 03/25/2025
- File Size 0.8MB
- # of Slides 2
- File Format PPTX
- Slide Ratio 4:3
- Color
Keywords
About the Product
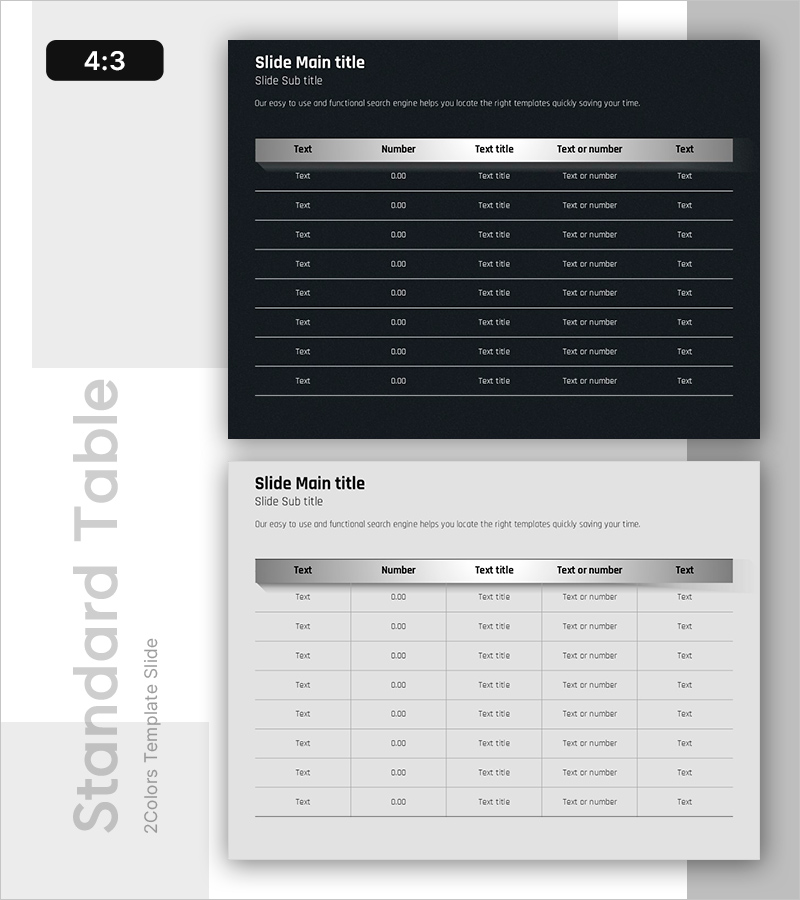
A 5-column table diagram PowerPoint slide with dark navy background and silver header design. This data visualization template organizes business metrics, sales figures, departmental KPIs, and quarterly results across five columns (Text, Number, Text title, Text or number, Text) with eight data rows. The bright gray header and dark row dividers enhance readability, while each cell accepts editable text and numeric values (0.00 format) for immediate use. Two-slide set includes both dark theme (navy background) and light theme (light gray background) versions, allowing you to match your presentation environment and document tone.
Usage Points
-
Main Usage
Organize and compare quantitative data (revenue, customer count, achievement rate, quarterly results) across five categories to communicate business performance at a glance. The clear distinction between header and data rows strengthens information hierarchy, while mixed text and numeric input enables diverse metric representation.
-
How to Use
Use in meetings, reports, and proposal slides to present departmental performance, quarterly sales status, customer satisfaction scores, and project progress rates. The dark theme suits executive-level reporting, while the light theme works well for internal team meetings and training materials.
-
Recommended For
Ideal for finance, sales, marketing, and operations teams preparing monthly, quarterly, or annual performance reports. Particularly useful for KPI dashboards, sales analysis, departmental goal achievement tracking, and customer segment comparison where quantitative data visualization is essential.
-
Slide Structure
Table format with five columns (Text, Number, Text title, Text or number, Text) and eight data rows. Header features silver gradient background with black text; data rows use dark background with bright text for contrast enhancement. Includes two slides: dark theme (navy background) and light theme (light gray background).
Related Products
-

Snow Mountain Theme Infinite Diagram – Business Strategy Sharing
#Business Vision and Strategy #Marketing Plan and Strategy #Diagram
-

Marketing Sequence Diagram – Effective Strategy Communication
#Diagram
-

Trial Tree Structure – Legal and Service Overview
#Technical Approach #Diagram #Service Architecture Diagram
-

Space Exploration Project Strategy Slide – Innovative Business Vision
#Business Vision and Strategy #Marketing Plan and Strategy #Diagram
