Analysis of Successful Revenue Performance Slide – Business Strategy and Financial Results
RB0800043_5
- Last Update 03/25/2025
- File Size 0.9MB
- # of Slides 2
- File Format PPTX
- Slide Ratio 4:3
- Color
Keywords
- #Content-Based Slides
- #Design-Based Slides
- #Business Strategy
- #Financial Plans and Performance
- #Graph
- #Financial Outlook & Expected Impact
- #Sales and Revenue
- #Line
- #Line Chart
- #4:3
- #line chart PowerPoint
- #revenue trend slide
- #data analysis presentation
- #business performance graph
- #financial reporting template
About the Product
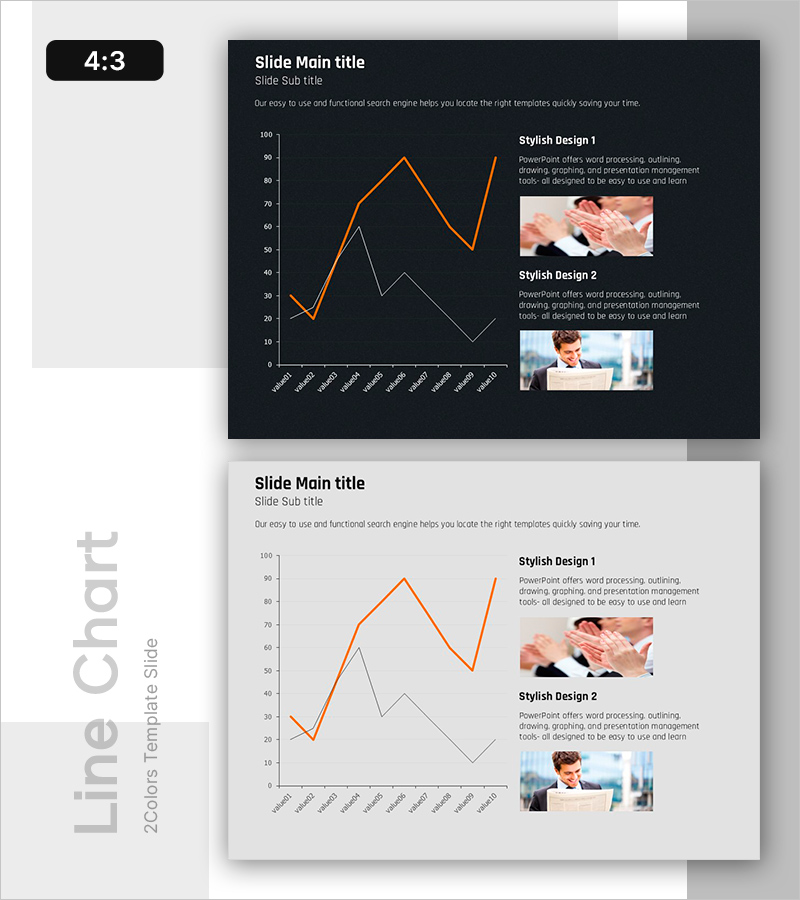
A dual-series line chart PowerPoint slide that visualizes revenue performance trends over time. Set against a dark background with orange and white lines for high contrast, this slide clearly communicates business results and financial metrics. Ideal for monthly or quarterly revenue comparisons, growth rate analysis, and performance tracking in presentations. The right side features dedicated image and text areas for supplementary visuals and explanations, making it perfect for business reports, strategic planning presentations, and financial performance reviews. Fully editable and ready to customize with your data.
Usage Points
-
Main Usage
Compare monthly or quarterly revenue changes, growth rates, and performance trends using two data series. This slide serves as a key visualization tool for business performance analysis, financial reporting, and marketing results presentations, supporting data-driven decision-making.
-
How to Use
Input your monthly or quarterly figures to compare two trend lines. Add relevant images to the right-side image areas and include insights in the text sections to create a compelling presentation. Colors and data ranges are fully customizable to match your branding.
-
Recommended For
CFOs, finance managers, business directors, and marketing leaders presenting business results and financial status to executives, investors, and stakeholders. Suitable for quarterly earnings reports, annual business reviews, investor presentations, and executive management meetings.
-
Slide Structure
Left side features a dual-series line chart with X-axis (months/quarters) and Y-axis (values). Orange line shows upward trend; white line shows variable trend. Right side includes two image insertion areas (top and bottom) with accompanying text explanation zones. 4:3 aspect ratio, 2-slide set.
Related Products
-

Changes in Pet Plant References – Financial Performance Analysis
#Business Strategy #Financial Plans and Performance #Graph
-

Medical Industry Growth Trends – Visualizing Financial Performance and Outlook
#Business Strategy #Financial Plans and Performance #Graph
-

Diet Line Chart – Visualizing Business Strategy
#Business Strategy #Graph #Financial Outlook & Expected Impact
-

Revenue Growth Target Graph – Effective Performance Presentation
#Business Strategy #Graph #Financial Outlook & Expected Impact
