Changes in Pet Plant References – Financial Performance Analysis
RJ0800008_24
- Last Update 08/29/2025
- File Size 0.9MB
- # of Slides 2
- File Format PPTX
- Slide Ratio 16:9
- Color
Keywords
- #Content-Based Slides
- #Design-Based Slides
- #Business Strategy
- #Financial Plans and Performance
- #Graph
- #Financial Outlook & Expected Impact
- #Sales and Revenue
- #Line
- #Line Chart
- #16:9
- #line chart PowerPoint
- #trend analysis slide template
- #dual-series graph
- #time-series data visualization
- #performance report PowerPoint slide
About the Product
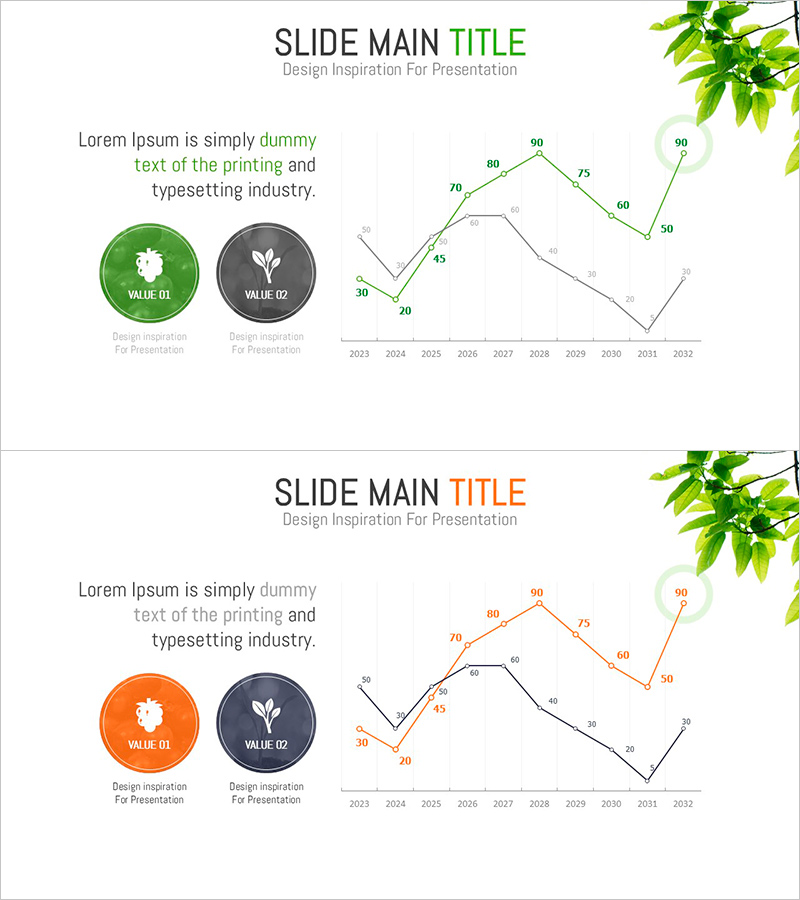
A PowerPoint slide featuring a dual-series line chart that visualizes 10-year trend data from 2023 to 2032. The green and orange lines clearly distinguish between two data sets, with numerical values displayed at each data point for precise comparative analysis. The left side includes two circular VALUE icons with descriptive text, while the upper right features a decorative plant illustration to enhance visual appeal. Provided in 16:9 widescreen PPTX format, all colors, values, and labels are fully editable to match your presentation needs.
Usage Points
-
Main Usage
Ideal for comparing two key metrics over time, this slide excels at visualizing financial performance, market trends, and sales progression. The dual-line format enables audiences to quickly grasp comparative trends and identify patterns across the decade-long dataset.
-
How to Use
Integrate into financial reports, business performance presentations, and marketing analysis decks. Replace the left-side text with your metric names and descriptions, then update the chart values and labels with your actual data for immediate use.
-
Recommended For
Finance teams, marketing departments, executives, management consultants, and data analysts preparing trend analysis reports. Suitable for quarterly and annual performance comparisons, competitive benchmarking, market share evolution, and multi-year business metrics.
-
Slide Structure
Two-slide set with each slide divided into left information panel (two circular icons plus text) and right chart area. The line chart contains two series (green and orange), ten data points spanning 2023–2032, Y-axis values, and legend.
Related Products
-

Medical Industry Growth Trends – Visualizing Financial Performance and Outlook
#Business Strategy #Financial Plans and Performance #Graph
-

Analysis of Successful Revenue Performance Slide – Business Strategy and Financial Results
#Business Strategy #Financial Plans and Performance #Graph
-

Garden Management Curve Graph
#Market and Competitor Analysis #Financial Plans and Performance #Graph
-

Fashion Market Sales Status Graph – Data Visualization and Trend Analysis
#Market and Competitor Analysis #Financial Plans and Performance #Graph
