Medical Industry Growth Trends – Visualizing Financial Performance and Outlook
RM0700012_9
- Last Update 02/27/2025
- File Size 0.3MB
- # of Slides 4
- File Format PPTX
- Slide Ratio 16:9
- Color
Keywords
- #Content-Based Slides
- #Design-Based Slides
- #Business Strategy
- #Financial Plans and Performance
- #Graph
- #Financial Outlook & Expected Impact
- #Sales and Revenue
- #Line
- #Line Chart
- #16:9
- #line chart PowerPoint slide
- #growth trend visualization
- #financial performance graph
- #market trend chart
- #line graph template download
- #data visualization presentation slide
About the Product
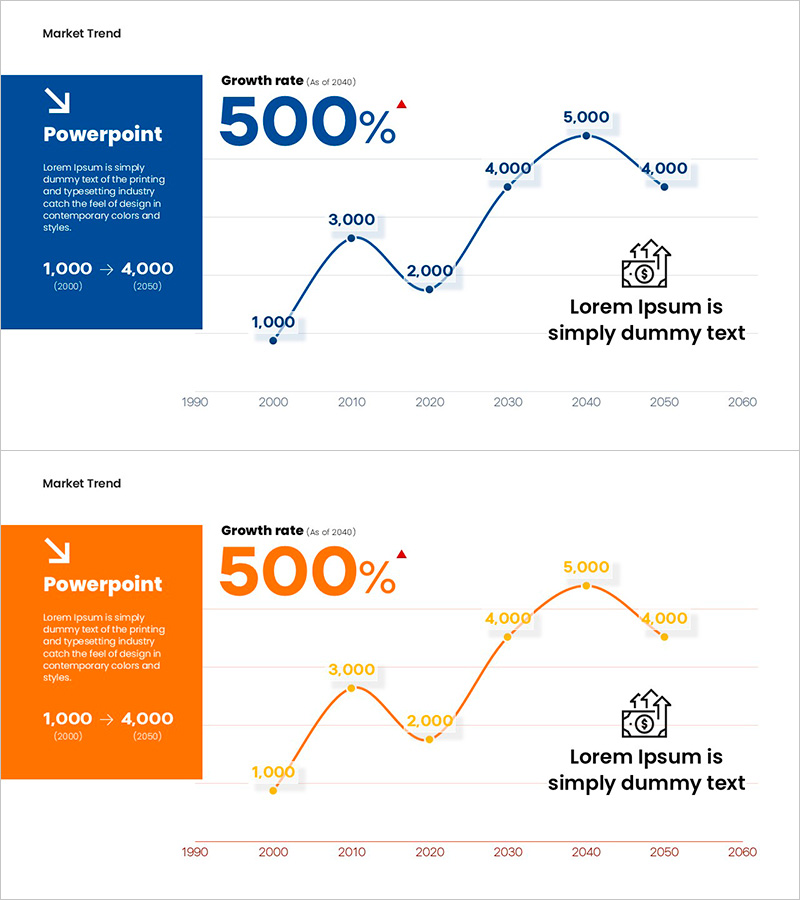
A 4-slide PowerPoint presentation visualizing medical industry growth trends with line charts. The deck features a 5-point data visualization spanning from 1990 to 2060, presented in navy blue and orange color schemes. Each slide combines a left-side information panel displaying key metrics (1,000→4,000, 500% growth rate) with a right-side line graph showing trend progression. The balanced layout effectively communicates financial performance, market dynamics, and growth forecasts for investor presentations, business reports, and strategic planning documents.
Usage Points
-
Main Usage
Clearly visualizes long-term growth rates and market trends using line charts. Effectively communicates growth stories to investors, executives, and stakeholders across healthcare, finance, technology, and other industries through compelling data-driven narratives.
-
How to Use
Apply to financial reports, business plans, investor pitch decks, and quarterly performance presentations. Update the left information panel with your key metrics and replace the graph data with actual statistics for immediate use in board meetings and investor relations.
-
Recommended For
Finance teams, executives, marketing professionals, consultants, and analysts requiring quantitative data presentations. Ideal for healthcare, pharmaceutical, financial services, and IT industries presenting performance analysis, market research findings, and investment briefings.
-
Slide Structure
4-slide set: 2 navy blue slides (1,000→4,000 growth, 500% rate) and 2 orange slides (matching structure, color variation). Each slide features left information panel (text and metrics) paired with right-side line graph (5 data points, X-axis 1990-2060, Y-axis 1,000-5,000 range).
Related Products
-

Analysis of Successful Revenue Performance Slide – Business Strategy and Financial Results
#Business Strategy #Financial Plans and Performance #Graph
-

Changes in Pet Plant References – Financial Performance Analysis
#Business Strategy #Financial Plans and Performance #Graph
-

Slide Visualizing Sales Performance Trend in the Kids Market
#Market and Competitor Analysis #Financial Plans and Performance #Graph
-

Rising Curve Graph for Sales Growth – Looking Ahead
#Market and Competitor Analysis #Financial Plans and Performance #Graph
