Investigating Specific Ranges in Scientific Line Graphs – Performance and Competitor Analysis
RB0800034_11
- Last Update 03/24/2025
- File Size 1.4MB
- # of Slides 2
- File Format PPTX
- Slide Ratio 4:3
- Color
Keywords
- #Content-Based Slides
- #Design-Based Slides
- #Business Strategy
- #Market and Competitor Analysis
- #Graph
- #Achievements
- #Competitor Analysis
- #Line
- #Line Chart
- #4:3
- #line chart PowerPoint
- #3-series line graph slide
- #data trend analysis presentation
- #performance comparison chart
- #competitor analysis PowerPoint
About the Product
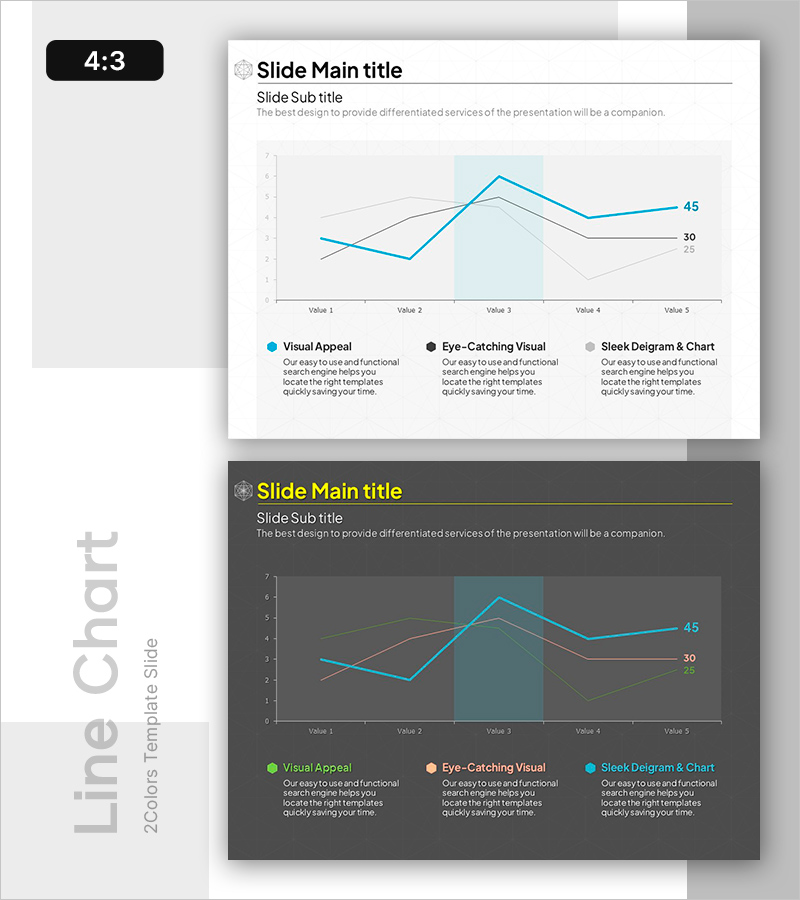
A PowerPoint slide featuring a 3-series line chart that compares performance metrics and competitor trends across 5 data points simultaneously. The design uses a light background with cyan, black, and gray line series to clearly distinguish each data set, while a highlighted range area emphasizes specific intervals and critical changes. The 2-slide set (4:3 aspect ratio) includes both light and dark theme versions, allowing flexible adaptation to different presentation environments. Ideal for market analysis, business strategy presentations, performance reports, and competitive benchmarking where quantitative data comparison is essential.
Usage Points
-
Main Usage
Optimized for comparing trends across three or more data series over time or categories. Displays performance indicators alongside competitor benchmarks to reveal relative positioning and directional changes at a glance, with a highlighted range area emphasizing critical intervals.
-
How to Use
Use in business strategy presentations, quarterly or annual performance reports, market analysis documents, and competitive landscape assessments. Edit line colors and range areas to match your actual data, then customize labels and legend entries as needed.
-
Recommended For
Finance professionals, marketing strategists, business analysts, executive report writers, market researchers, and product managers who need to present quantitative comparisons and trend analysis in formal presentations.
-
Slide Structure
Slide 1: Light background with 3 line series (cyan primary metric, black competitor, gray secondary metric), 5 data points, range highlight area (light blue), 3-item legend. Slide 2: Identical structure with dark theme (dark background, bright line series, cyan-teal highlight area).
Related Products
-

Traveler Visiting Rate Trends Graph – Market Trend Analysis
#Business Strategy #Market and Competitor Analysis #Graph
-

Competitor Comparison Analysis Graph - Highlighting Competitive Advantage
#Market and Competitor Analysis #Graph #Competitor Analysis
-

Rhombus Chart Template for Market Analysis – Competitive Analysis and Marketing Strategy
#Market and Competitor Analysis #Marketing Plan and Strategy #Graph
-

Sewing Graph Chart – Market Status and Performance Analysis
#Business Strategy #Market and Competitor Analysis #Diagram
