Traveler Visiting Rate Trends Graph – Market Trend Analysis
RJ0600095_10
- Last Update 07/16/2025
- File Size 0.7MB
- # of Slides 2
- File Format PPTX
- Slide Ratio 16:9
- Color
Keywords
- #Content-Based Slides
- #Design-Based Slides
- #Business Strategy
- #Market and Competitor Analysis
- #Graph
- #Achievements
- #Competitor Analysis
- #Line
- #Line Chart
- #16:9
- #line chart PowerPoint slide
- #dual-series trend analysis
- #10-year data visualization
- #market trend presentation template
- #PowerPoint graph slide download
About the Product
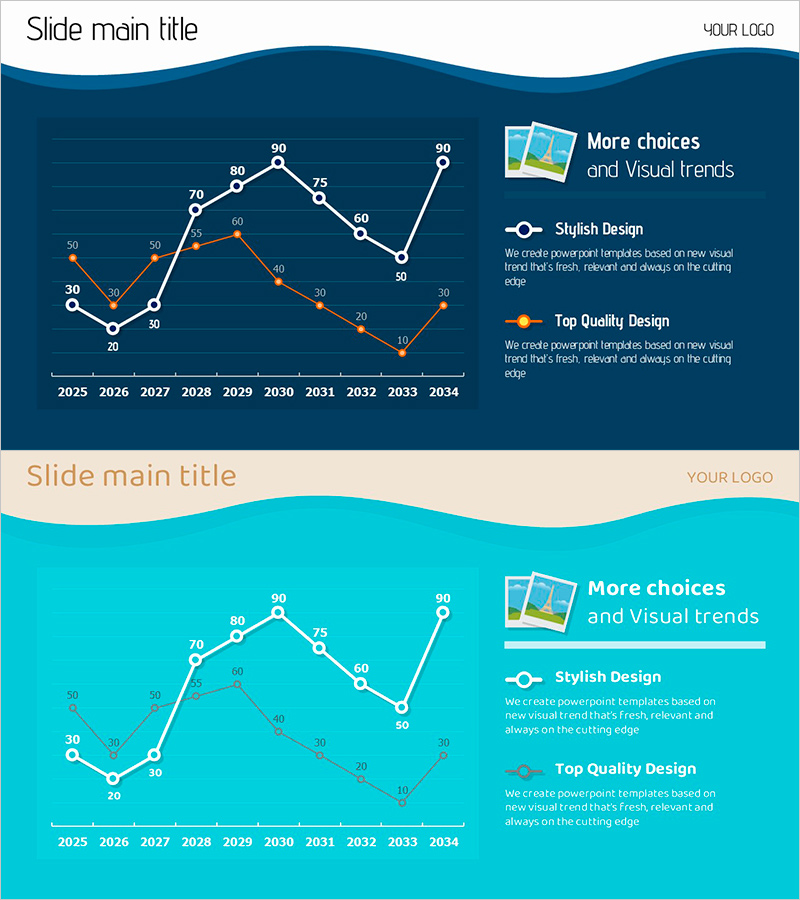
A dual-series line chart PowerPoint slide visualizing traveler visiting rate trends over a 10-year period from 2025 to 2034. Set against a dark navy background, the slide features white and orange line series with clearly labeled data points at each interval. The right side includes two descriptive sections highlighting 'Stylish Design' and 'Top Quality Design' features. This presentation template is ready for immediate use in business reports, market trend analysis, performance reviews, and competitive analysis presentations.
Usage Points
-
Main Usage
This slide effectively compares two or more data series over time, making it ideal for visualizing trends such as visitor rates, revenue growth, customer satisfaction scores, or market share changes. The clear data point labeling and dual-color coding enable stakeholders to quickly understand performance trajectories and identify key patterns.
-
How to Use
Use this slide in quarterly or annual performance reports, market analysis presentations, competitive benchmarking sessions, and strategic planning meetings. The description boxes on the right side can be customized to highlight key insights, strategic implications, or actionable recommendations derived from the trend data.
-
Recommended For
Marketing managers, sales directors, financial analysts, business consultants, and strategy teams analyzing market dynamics, sales performance, customer metrics, or operational KPIs. Particularly effective for investor presentations, board meetings, and multi-year comparative analysis requiring clear trend visualization.
-
Slide Structure
Two-slide set with dark navy wave header, centered dual-series line chart (10 data points per series, 2025–2034 timeline), and right-aligned description boxes (2 sections). Y-axis range 10–90 with gridlines for easy value reading. White circular nodes mark one series, orange nodes mark the second series, with connecting lines showing trend direction.
Related Products
-

Investigating Specific Ranges in Scientific Line Graphs – Performance and Competitor Analysis
#Business Strategy #Market and Competitor Analysis #Graph
-

War and Broken Line Graph – Market and Competitor Analysis Strategy
#Business Strategy #Market and Competitor Analysis #Graph
-

Sewing Graph Chart – Market Status and Performance Analysis
#Business Strategy #Market and Competitor Analysis #Diagram
-

Rhombus Chart Template for Market Analysis – Competitive Analysis and Marketing Strategy
#Market and Competitor Analysis #Marketing Plan and Strategy #Graph
