Competitor Comparison Analysis Graph - Highlighting Competitive Advantage
RJ0300051_17
- Last Update 05/02/2025
- File Size 2.6MB
- # of Slides 2
- File Format PPTX
- Slide Ratio 16:9
- Color
Keywords
- #Content-Based Slides
- #Design-Based Slides
- #Market and Competitor Analysis
- #Graph
- #Competitor Analysis
- #Competitive Advantage
- #Line
- #Line Chart
- #16:9
- #line chart PowerPoint
- #trend analysis slide
- #competitor comparison graph
- #dual-series chart template
- #market analysis presentation
- #data visualization slide
- #how to create line chart in PowerPoint
About the Product
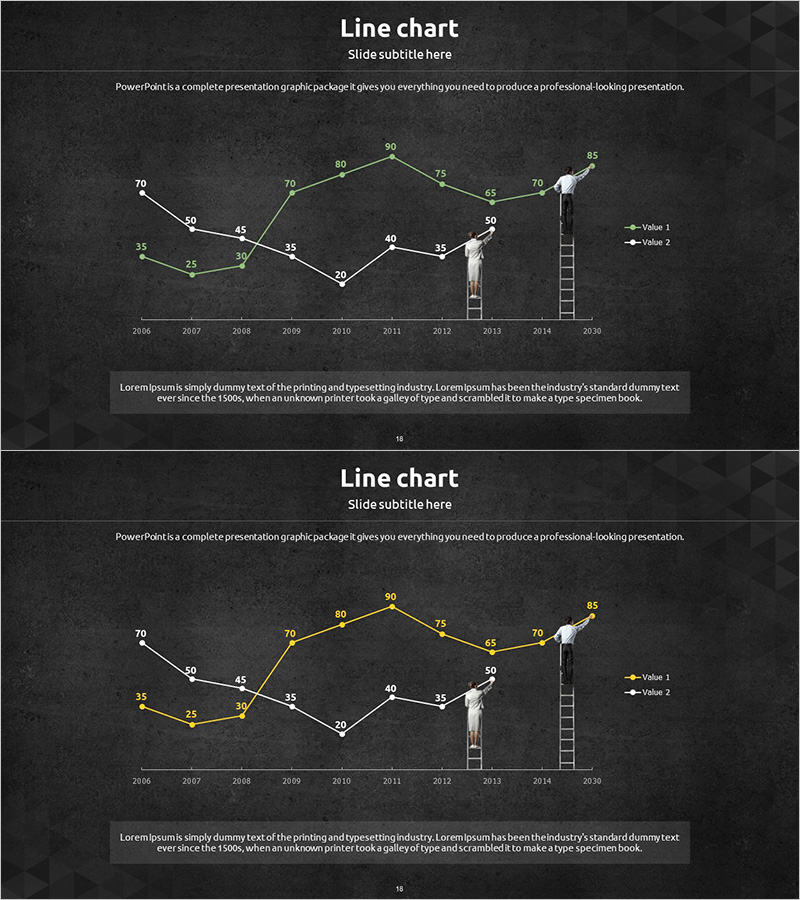
A dual-series line chart PowerPoint slide designed to visualize competitive analysis and market trends over time. Set against a charcoal background, white and green data lines create clear contrast for comparing two key performance indicators. The chart tracks year-over-year changes from 2006 to 2015, with numeric labels at each data point for precise value comparison. Ladder-shaped icon elements emphasize growth stages, while a legend clearly distinguishes between the two data series. This presentation template effectively communicates competitive positioning and performance trajectories in business reports, strategic analyses, and investor presentations.
Usage Points
-
Main Usage
Compare competitor performance metrics against your own using two distinct data series to highlight competitive advantage. Clearly visualize trend changes over time with numeric labels at each data point, enhancing data credibility and enabling precise year-over-year analysis.
-
How to Use
Deploy in strategy meetings, investor presentations, and quarterly performance reviews to explain competitive positioning. Emphasize the intersection points and gaps between the two lines to effectively communicate competitive analysis findings and support strategic planning decisions.
-
Recommended For
Marketing managers, strategy planning teams, and executives presenting competitive analysis results. Ideal for market research reports, business plans, quarterly performance reports, and investor pitch decks where competitive positioning needs to be highlighted.
-
Slide Structure
Comprises two data series represented as line graphs tracking ten years of data (2006–2015) with numeric labels at each point. A legend on the right distinguishes Value 1 and Value 2. A text area at the bottom accommodates additional analytical commentary and insights.
Related Products
-

Neon Tone Competitor Analysis Broken Line Graph
#Market and Competitor Analysis #Graph #Competitor Analysis
-

Business Competitor Analysis Graph
#Market and Competitor Analysis #Graph #Competitor Analysis
-

Competition Graphs and Analysis – Slides for Market Advantage
#Market and Competitor Analysis #Graph #Competitor Analysis
-

Default Line Graph for Market & Competitor Analysis – Competitive Advantage
#Market and Competitor Analysis #Graph #Competitor Analysis
