Structuring a Strong Future - Timeline Diagram Slide
RB0800033_4
- Last Update 03/24/2025
- File Size 6.5MB
- # of Slides 2
- File Format PPTX
- Slide Ratio 4:3
- Color
Keywords
About the Product
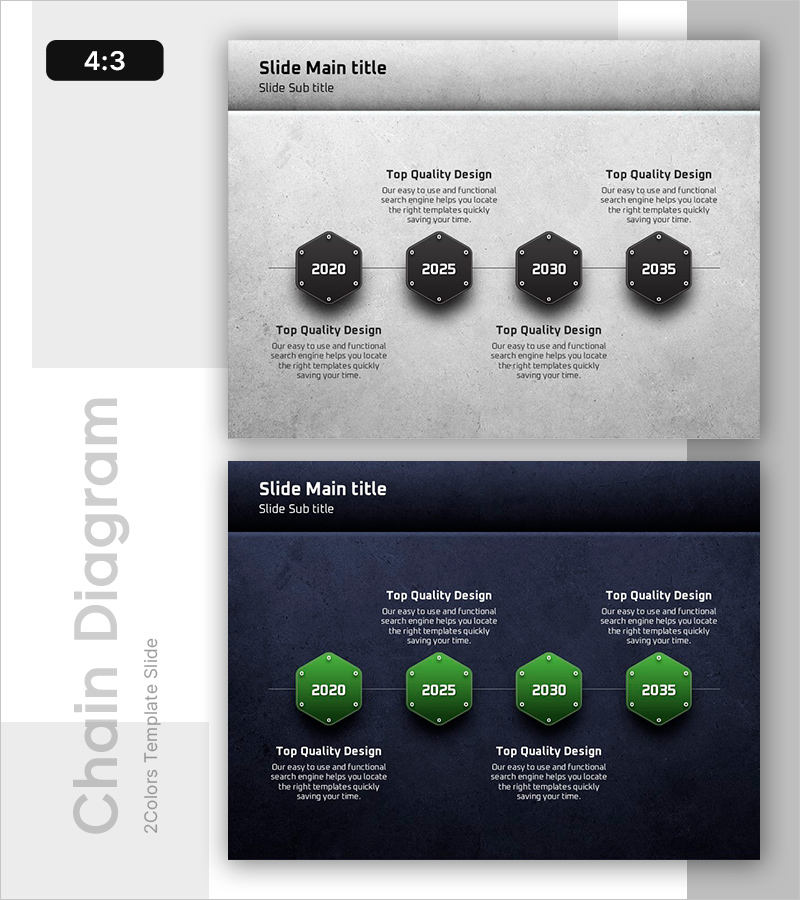
A connected diagram PowerPoint slide featuring four hexagonal nodes arranged in a linear timeline structure. Perfect for visualizing company milestones, project phases, strategic roadmaps, and historical progression in chronological order. The design combines a gray textured background with black hexagons and white typography, with connecting lines emphasizing sequential flow between stages. Two slide variations are included: one with a light gray background and another with a dark navy background, providing flexibility for different presentation contexts. Delivered in 4:3 aspect ratio PPTX format, fully editable and ready to customize with your own content.
Usage Points
-
Main Usage
Designed to present company history, business development stages, project timelines, and strategic roadmaps in chronological sequence. Each hexagonal node can display a year, milestone, or phase name, with supporting text below to describe achievements, events, or key metrics associated with each stage.
-
How to Use
Enter the year or phase name in the center of each hexagon node, and add descriptive text in the area below to explain the corresponding milestone or achievement. Customize node colors or select your preferred background (gray or navy) to match your presentation theme. The 4:3 aspect ratio is optimized for large-screen presentations and conference displays.
-
Recommended For
Ideal for company profile presentations (company history section), executive reports (business performance overview), investor pitch decks (growth trajectory), strategic planning presentations (roadmap visualization), and educational seminars (learning progression). Particularly effective when emphasizing chronological development and staged transformation.
-
Slide Structure
Two-slide set. Each slide features four hexagonal nodes connected linearly from left to right. Layout includes a title area at the top, centered hexagon nodes with editable year/phase labels, and descriptive text fields below each node. First slide uses light gray background; second slide features dark navy background for visual variety.
Related Products
-

Spade Shape Theme History Diagram – Emphasizing Company Development
#Company Introduction #Diagram #History
-

Fountain Pen History Diagram – Emphasizing Corporate Identity
#Company Introduction #Product/Service Introduction #Diagram
-

Business Connection Diagram – Cluster and History
#Company Introduction #Diagram #Company Overview
-

Business History Connection Diagram – Company Growth Story
#Company Introduction #Diagram #History
