Silhouette History Diagram – Visualizing Evolution
RJ0300051_4
- Last Update 05/02/2025
- File Size 7.6MB
- # of Slides 2
- File Format PPTX
- Slide Ratio 16:9
- Color
Keywords
- #Content-Based Slides
- #Design-Based Slides
- #Company Introduction
- #Diagram
- #Other
- #History
- #Cluster
- #Chain Diagram
- #Silhouette
- #16:9
- #silhouette diagram PowerPoint
- #history timeline slide
- #corporate evolution diagram
- #company growth presentation
- #silhouette timeline template
- #evolution flow PowerPoint slide
About the Product
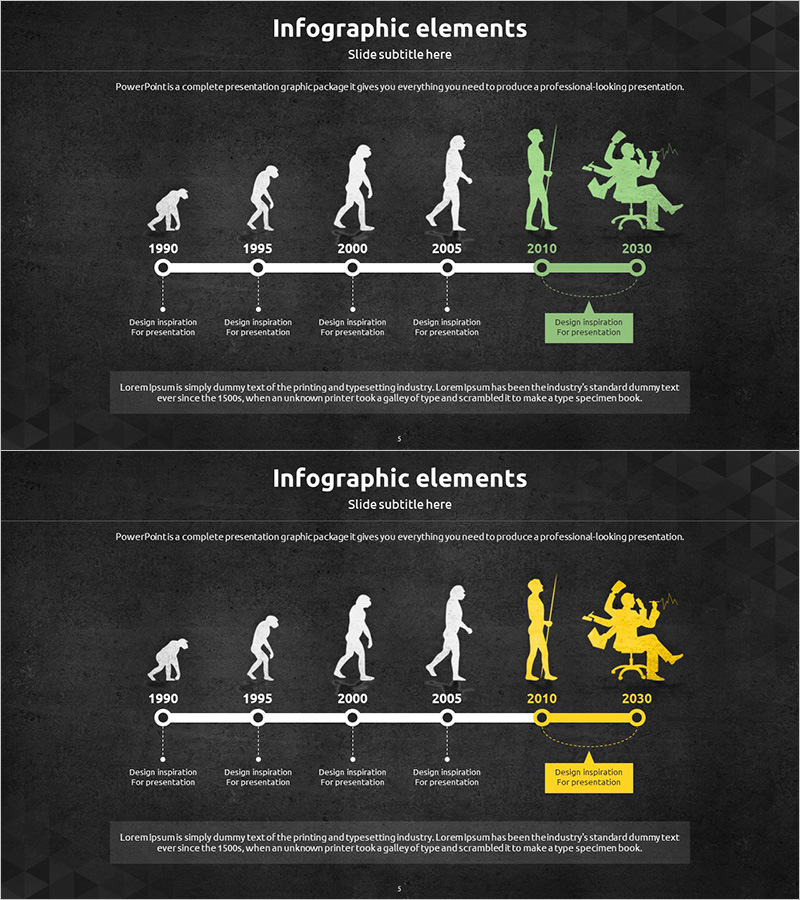
A silhouette-based history timeline diagram PowerPoint slide designed to visualize corporate growth, product evolution, or organizational development over time. The slide features six silhouette figures representing stages from 1990 to 2030, connected by a linear timeline to show transformation at a glance. Dark background with white silhouettes and accent colors (green and yellow) emphasize each milestone. Two-slide set includes color variations for flexible presentation styling. Each node includes a text area for detailed descriptions, making it suitable for company introductions, product launches, organizational expansion, and strategic planning presentations. Fully editable PPTX format in 16:9 widescreen ratio compatible with all PowerPoint versions.
Usage Points
-
Main Usage
Visualizes corporate history, product evolution, and organizational growth over time using silhouette figures and linear timeline layout. Silhouettes convey abstract concepts like growth, change, and development intuitively, while text areas provide specific context for each milestone.
-
How to Use
Insert into company introduction presentations under 'Company History' section, product launch decks under 'Technology Evolution,' or executive reports under 'Organizational Growth.' Edit silhouettes and text boxes with your data, and adjust accent color placement to highlight key milestones.
-
Recommended For
Company introduction decks, product launch presentations, business plans, executive reports, investor pitch decks, organizational restructuring announcements, and brand history presentations. Particularly effective for B2B presentations and internal communications emphasizing change over time.
-
Slide Structure
Two-slide set with identical layout and color variations. Each slide features a horizontal timeline with six nodes (1990, 1995, 2000, 2005, 2010, 2030) and descriptive text boxes below each node. First slide uses green accent color; second uses yellow accent for flexible presentation styling.
Related Products
-

Timeline of Health Routine Evolution – Visualizing Business Strategies
#Company Introduction #Business Strategy #Diagram
-

Cluster Diagram for Denim History – Design and Practicality
#Company Introduction #Business Management #Diagram
-

Milestones in Motion: A Connected Diagram – Flowing Timeline
#Company Introduction #Diagram #History
-

Growth Over Time Slide – Cluster and Connection Design
#Company Introduction #Diagram #History
