Denim PPT Vertical Bar Graph Analysis – Market and Competitor Analysis
RB0800023_6
- Last Update 03/22/2025
- File Size 7.4MB
- # of Slides 2
- File Format PPTX
- Slide Ratio 4:3
- Color
Keywords
- #Content-Based Slides
- #Design-Based Slides
- #Business Strategy
- #Market and Competitor Analysis
- #Graph
- #Financial Outlook & Expected Impact
- #Future Outlook
- #Column
- #Column Chart
- #4:3
- #vertical bar chart PowerPoint
- #bar graph slide template
- #data comparison presentation
- #numerical visualization PPT
- #market analysis PowerPoint slide
About the Product
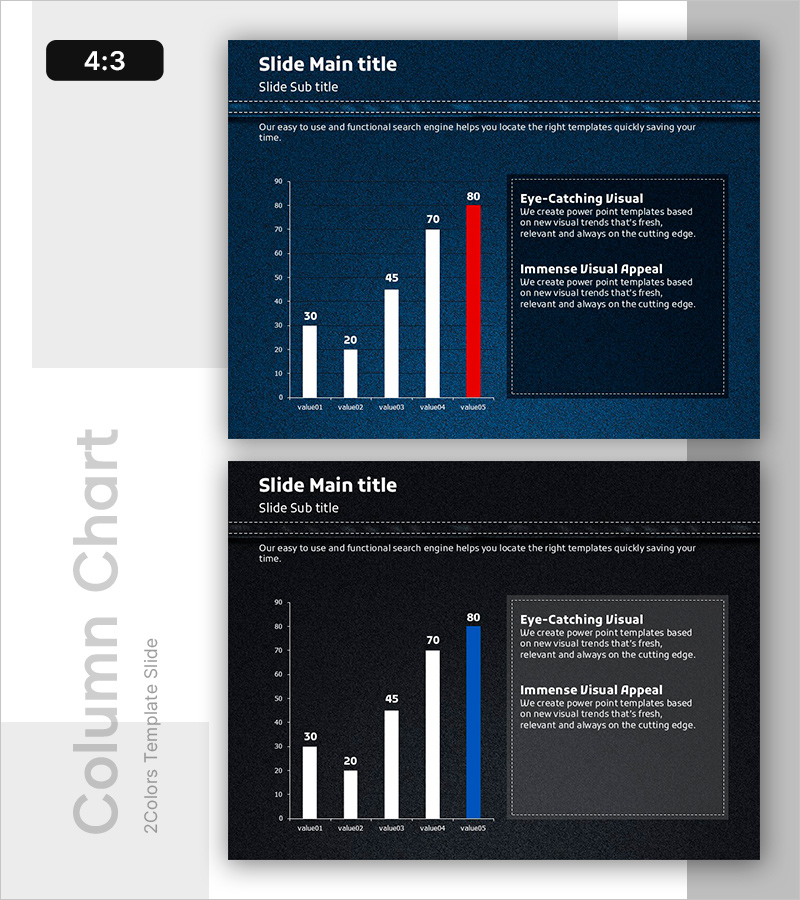
A vertical bar chart PowerPoint slide featuring a denim-toned dark blue background with white and red accent colors for clear data visualization. Designed to compare five data points effectively, with a text box on the right side for key insights and analysis. This presentation slide is ready to use for market analysis, competitor benchmarking, revenue forecasting, and quantitative data-driven presentations. The 2-slide set offers multiple color combinations (white and red emphasis), compatible with 4:3 aspect ratio across all platforms.
Usage Points
-
Main Usage
This slide is optimized for comparing quantitative data across items and displaying rankings. The five-item bar chart combined with the right-side text box allows simultaneous presentation of numerical data and analytical insights, making it ideal for data-driven decision-making presentations.
-
How to Use
Replace bar heights and values with your own data, then input analysis results or strategic recommendations in the right text box. Use white bars for baseline values and red bars to highlight key items, drawing audience attention to critical data points. Choose from two color combination options in the 2-slide set.
-
Recommended For
Recommended for executives, marketing teams, sales teams, and strategic planning departments preparing quarterly reports, performance analysis, market research presentations, competitive benchmarking materials, and investor presentations. Particularly suitable for B2B presentations requiring data-driven decision-making.
-
Slide Structure
Each slide contains a title and subtitle area, a vertical bar chart with five items (Y-axis range 0–90, X-axis with five categories), and a right-aligned text box with dashed border for two-paragraph input. The denim-toned background with white and red color contrast allows flexible emphasis adjustment for data visualization.
Related Products
-

Learning Future Outlook Vertical Bar Graph – Market Analysis and Expected Effects
#Business Strategy #Market and Competitor Analysis #Graph
-

Comparison Graph Before and After Growth – Business Insights
#Business Strategy #Market and Competitor Analysis #Graph
-

Technology Service Future Outlook and Expected Effect – High-Quality Graph Design
#Business Strategy #Market and Competitor Analysis #Graph
-

Donation Participation Rate Graph – Business Strategy and Future Outlook
#Business Strategy #Market and Competitor Analysis #Graph
