Vertical Bar Graph Flow – Market and Performance Analysis
RJ0500016_9
- Last Update 06/11/2025
- File Size 0.5MB
- # of Slides 2
- File Format PPTX
- Slide Ratio 16:9
- Color
Keywords
- #Content-Based Slides
- #Design-Based Slides
- #Business Strategy
- #Market and Competitor Analysis
- #Graph
- #Achievements
- #Future Outlook
- #Column
- #Column Chart
- #16:9
- #vertical bar chart PowerPoint
- #bar graph slide template
- #performance analysis chart
- #year-over-year comparison
- #how to create bar chart in PowerPoint
About the Product
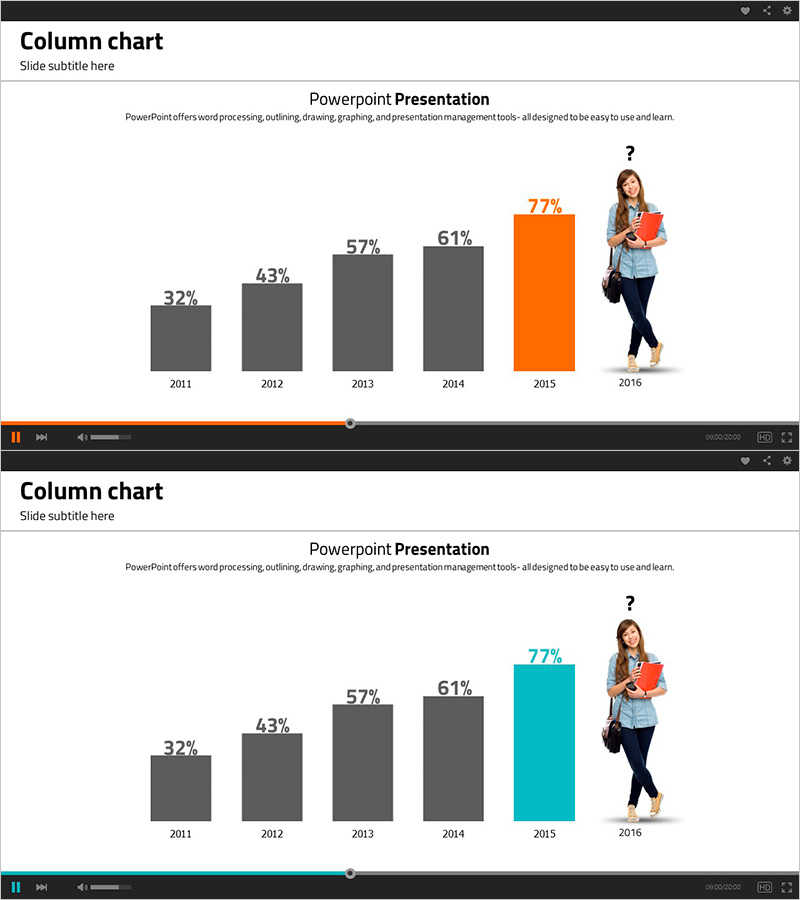
A vertical bar chart PowerPoint slide visualizing performance data across six years from 2011 to 2016. The design uses a two-tone color scheme with charcoal gray and bright orange to emphasize the latest year's achievement, complemented by an illustrated character on the right side for visual impact. This slide is ready to use in business presentations requiring year-over-year comparisons such as market analysis, sales performance, and growth trends. Provided as a 2-slide PPTX file in 16:9 widescreen format for seamless integration into your presentation deck.
Usage Points
-
Main Usage
Effectively visualizes numerical comparisons across years, quarters, or categories while highlighting performance trends. The orange accent bar draws attention to the latest achievement or target accomplishment, making it ideal for emphasizing growth or success metrics.
-
How to Use
Insert this slide into business reports, quarterly earnings presentations, or market analysis decks when explaining year-over-year performance. Easily edit the data values and labels to match your specific metrics, and the illustrated character adds a friendly, approachable tone to your presentation.
-
Recommended For
Sales and marketing professionals presenting quarterly or annual results, executives delivering business performance updates, consultants analyzing market trends, and finance teams reporting annual financial performance. Particularly effective for investor presentations and company-wide performance sharing where upward trends need emphasis.
-
Slide Structure
Six vertical bars representing years 2011 through 2016, each displaying percentage values at the top. The first five bars are rendered in dark gray while the final bar is highlighted in bright orange for emphasis. An illustrated female character holding a folder is positioned on the right side of the chart.
Related Products
-

Performance Column Graph – Business Strategy and Competitor Analysis
#Business Strategy #Market and Competitor Analysis #Graph
-

Market Trends and Analysis Charts – Delivering Business Insights
#Business Strategy #Market and Competitor Analysis #Graph
-

Exercise Ability Improvement Graph
#Business Strategy #Market and Competitor Analysis #Graph
-

Growing Demand for Organic Agricultural Products Bar Chart
#Business Strategy #Market and Competitor Analysis #Graph
