Stylish Map Presentation Slide
RB0800028-1_11
- Last Update 03/23/2025
- File Size 0.4MB
- # of Slides 2
- File Format PPTX
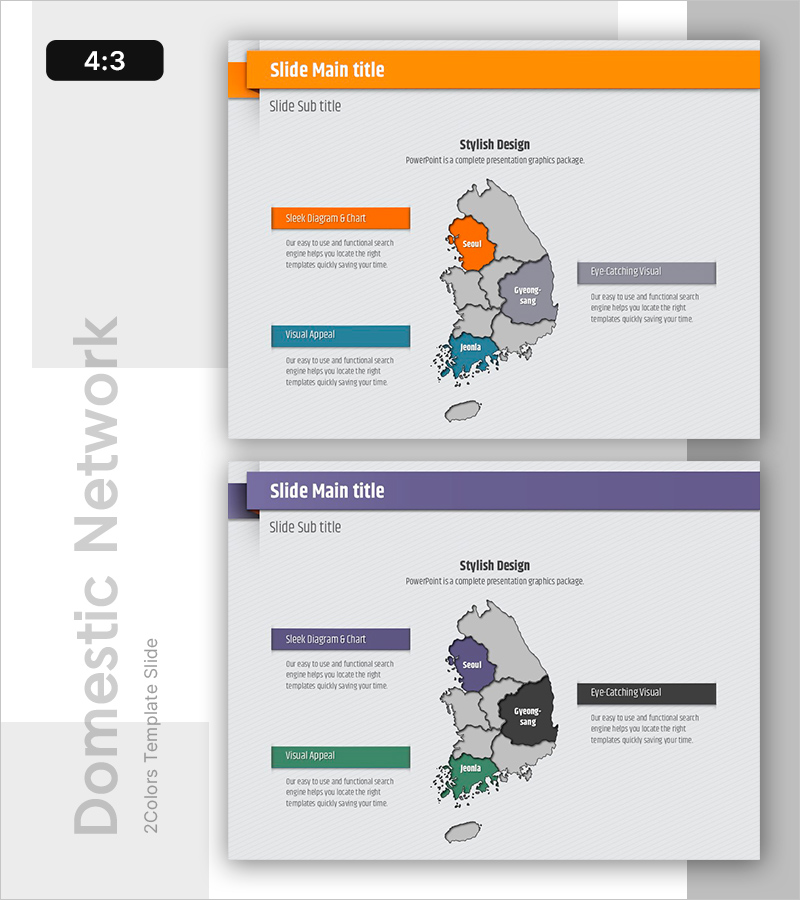
- Slide Ratio 4:3
- Color
Keywords
About the Product
A 2-slide PowerPoint presentation set featuring a Korea map diagram for regional data visualization. The map highlights four distinct regions (Seoul, Gyeonggi, Jeolla, Jeju) in orange, blue, gray, and black color schemes, with customizable text boxes for regional descriptions. The layout includes an orange header bar at the top for titles, a central map diagram on the left side, and designated text areas on the right for visual emphasis and detailed explanations. This slide template is optimized for regional marketing presentations, business reports, and geographic analysis. Available in 4:3 aspect ratio PPTX format, fully editable and ready to use.
Usage Points
-
Main Usage
Communicate regional business performance, marketing strategies, and geographic analysis data through map-based visualization. The color-coded regions draw audience attention to specific areas, while text boxes enable clear presentation of region-specific insights and metrics.
-
How to Use
Enter your presentation title in the orange header bar at the top. Add regional statistics and data in the diagram section on the left side. Fill in regional descriptions, strategies, and outcomes in the right-side text boxes to comprehensively present geographic information.
-
Recommended For
Regional marketing managers, business development teams, geographic analysis report writers, and professionals in real estate, retail, and logistics industries. Suitable for local government agencies, tourism boards, and regional economic analysis institutions presenting policy updates.
-
Slide Structure
2-slide set. Each slide features an orange header bar (title and subtitle area), a central Korea map with 4 color-coded regions (Seoul in orange, Gyeonggi/Gangwon in gray, Jeolla in blue, Jeju in black), left-side text boxes for diagram and chart descriptions, and right-side text boxes for visual emphasis and detailed information.
Related Products
-

Marketing Strategy for Eco-friendly Business Project Goals
#Marketing Plan and Strategy #Other #Target Market Strategy
-

Market Analysis Infographic Slide on Depression – Understanding and Empathy
#Market and Competitor Analysis #Other #Market Analysis
-

European Network Presentation Template – Market and Competitor Analysis
#Market and Competitor Analysis #Graph #Other
-

Global Network Visualization through CSR Map - Corporate Social Responsibility
#Company Introduction #Market and Competitor Analysis #Other
