Brief Survey of the Region Slide – Effective Data Visualization
RJ0600069_18
- Last Update 07/08/2025
- File Size 4.9MB
- # of Slides 2
- File Format PPTX
- Slide Ratio 16:9
- Color
Keywords
About the Product
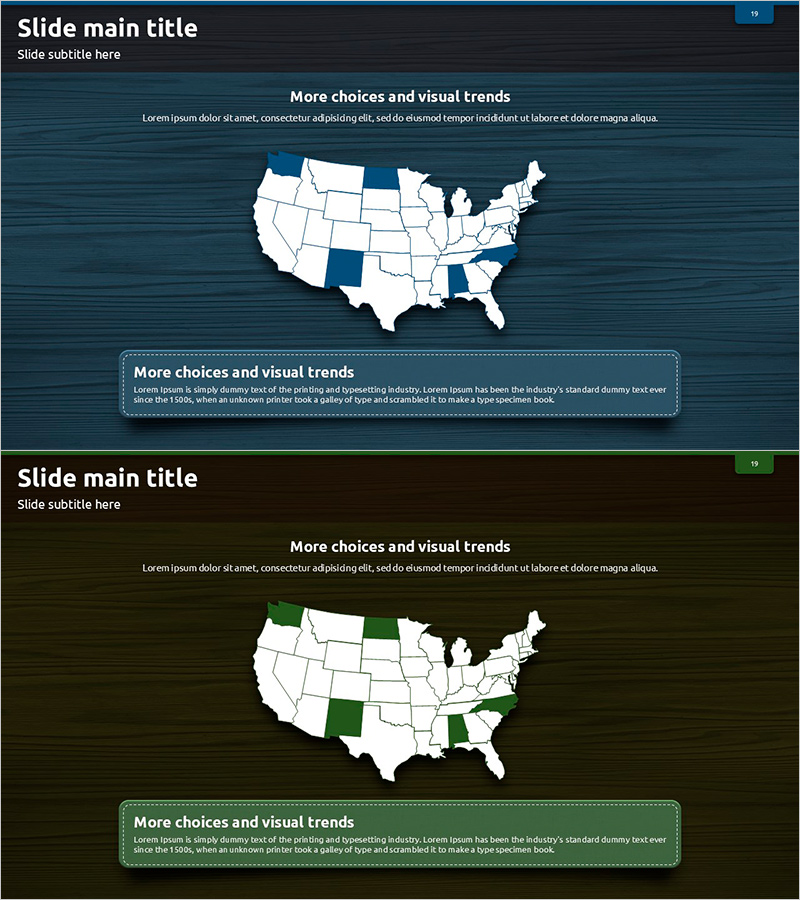
A map-based slide template for visualizing regional conditions across the United States at a glance. Featuring a dark blue background with white state boundaries and accent colors to highlight specific regions, this slide is optimized for market research, regional analysis, and sales network presentations. The 2-slide PowerPoint set separates text description areas from map visualization zones, making data entry straightforward. Ideal for company profile global network sections, market analysis reports, sales strategy presentations, and regional business updates.
Usage Points
-
Main Usage
Visualize regional market conditions, sales network distribution, and customer location analysis through map-based graphics to support decision-making. Highlight key markets or strategic regions using accent colors for clear communication.
-
How to Use
Enter your analysis topic in the title area at the top, then add regional descriptions or statistical data in the text box below the map. Change region colors to represent market share, growth rates, customer concentration, or other regional metrics.
-
Recommended For
Recommended for company profile global network and domestic sales network sections, market analysis reports, sales strategy presentations, regional business status updates, and investor pitch decks explaining market scope.
-
Slide Structure
2-slide format with each slide containing a title and subtitle area at the top, a US map with state-level boundaries in the center, and a description text box at the bottom. Specific states can be highlighted in accent colors (dark blue, green, etc.) to enable comparative analysis.
Related Products
-

South Korea Target Area Infrastructure Map – Market and Competitor Analysis
#Company Introduction #Market and Competitor Analysis #Other
-

Aurora Analysis by US Region – Visualization for Insights
#Company Introduction #Market and Competitor Analysis #Other
-

Market Analysis with Map Infographic Illustration – Strategies for Business Success
#Company Introduction #Market and Competitor Analysis #Other
-

USA Domestic Network Map – Market and Competitor Analysis
#Company Introduction #Market and Competitor Analysis #Other
