Europe and New York Map Market Share Table
RJ0600072_15
- Last Update 07/09/2025
- File Size 0.9MB
- # of Slides 2
- File Format PPTX
- Slide Ratio 16:9
- Color
Keywords
- #Content-Based Slides
- #Design-Based Slides
- #Market and Competitor Analysis
- #Diagram
- #Other
- #Target Market
- #Table
- #Standard Table
- #Map
- #16:9
- #Europe map PowerPoint slide
- #geographic data visualization
- #market share table
- #regional analysis PPT
- #competitive analysis presentation
- #global business slide template
About the Product
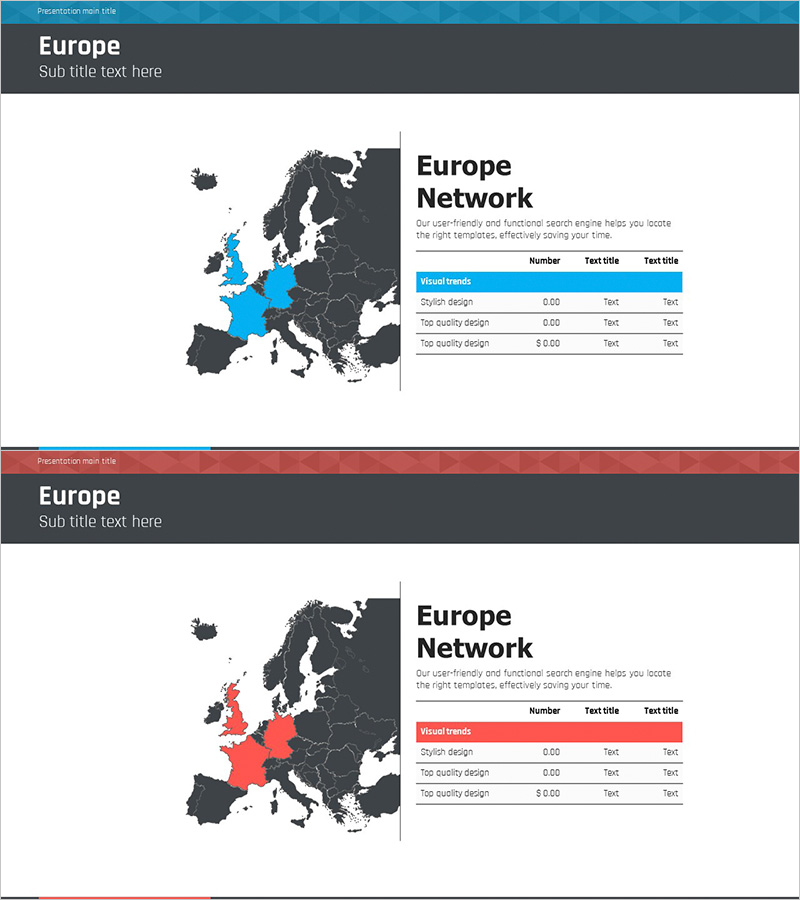
A PowerPoint slide that visualizes Europe's market share using a geographic map and data table. The design features a gray background map of Europe with blue and red highlighting to emphasize key regions, paired with a structured data table on the right side. This 2-slide set presents the same layout with color variations, making it ideal for comparative analysis presentations. Perfect for marketing strategy, competitive analysis, and regional sales performance reports that require immediate deployment.
Usage Points
-
Main Usage
Effectively communicate regional market share, sales performance, and customer distribution across Europe by combining geographic visualization with quantitative data tables for clear comparative analysis.
-
How to Use
Use in marketing strategy presentations, competitive analysis reports, regional sales performance briefings, and global business expansion plans where geographic data emphasis is critical.
-
Recommended For
Marketing managers, sales directors, executives, management consultants, market research analysts, and business professionals requiring data-driven regional decision-making.
-
Slide Structure
Left side displays a gray-background Europe map with key countries (UK, France, Germany) highlighted in blue or red; right side contains a 3-row by 4-column data table with headers (Visual trends, Stylish design, Top quality design) for numerical comparison.
Related Products
-

European Target Region Analysis Table – Marketing Strategy Development
#Market and Competitor Analysis #Marketing Plan and Strategy #Diagram
-

Business Plan Presentation Template - Asia Map
#Market and Competitor Analysis #Diagram #Other
-

Botanic Garden Wide PPT Map – A Visual Tool for Effective Market Analysis
#Market and Competitor Analysis #Diagram #Other
-

Target Country Analysis Table – The Ideal Tool for Market Analysis
#Market and Competitor Analysis #Diagram #Other
