Market Analysis Infographic Slide on Depression – Understanding and Empathy
RJ0600077_11
- Last Update 07/10/2025
- File Size 7.6MB
- # of Slides 2
- File Format PPTX
- Slide Ratio 16:9
- Color
Keywords
About the Product
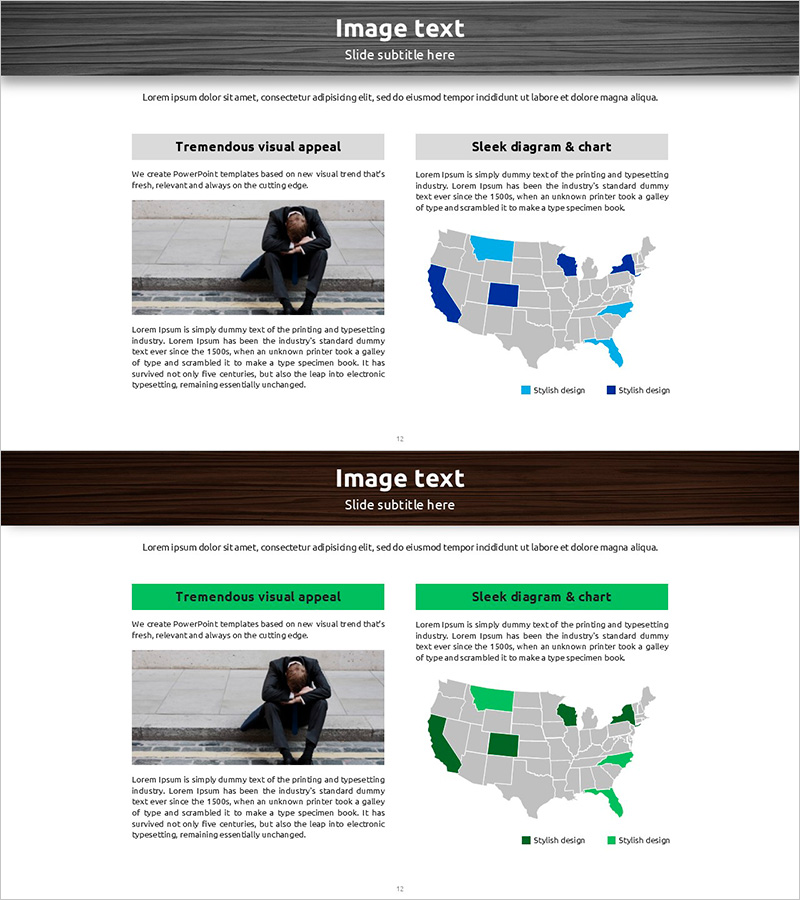
A 2-slide PowerPoint presentation featuring a US map infographic that visualizes regional data across the country. The slides use a gray background with blue and green color schemes to distinguish different regions, making it ideal for market analysis, regional statistics, and business performance comparisons. Each slide includes a title area, descriptive text section, and a map visualization zone with space for additional images or information on the left side. Available in 16:9 widescreen PPTX format, fully editable and ready to use in marketing reports, business analysis presentations, and regional strategy briefings.
Usage Points
-
Main Usage
Present regional market conditions, business distribution, and customer analysis using map-based infographics to support decision-making with visual clarity. The dual-color scheme (blue and green) emphasizes comparative analysis and enhances audience comprehension of geographic trends.
-
How to Use
Insert into the market analysis section of marketing reports, regional strategy portions of business plans, or business performance presentations at investor meetings. Double-click map regions to input data, and edit title and description text to reflect your specific analysis and findings.
-
Recommended For
Marketing professionals, business planning teams, regional sales managers, and investor relations specialists presenting regional performance, market share, or customer distribution data. Particularly effective for global companies analyzing the US market and presenting geographic expansion strategies.
-
Slide Structure
Two-slide layout with each slide featuring a gray header title area, central US map infographic with color-coded regions (blue and green), left-side space for images or additional text, and bottom descriptive text section. Optimized for 16:9 widescreen format suitable for modern presentation environments.
Related Products
-

Global Market Snapshot – Market Analysis and Outlook
#Company Introduction #Market and Competitor Analysis #Diagram
-

Household Survey by Region Slide – Visualizing Market Analysis Template
#Market and Competitor Analysis #Other #Market Analysis
-

Brown Background Global Market Analysis – Utilizing Cluster Diagrams
#Market and Competitor Analysis #Diagram #Other
-

Global Network Market Trends – Insights through Data Visualization
#Company Introduction #Market and Competitor Analysis #Graph
