Global Network Visualization through CSR Map - Corporate Social Responsibility
RJ0600088_7
- Last Update 07/14/2025
- File Size 0.8MB
- # of Slides 2
- File Format PPTX
- Slide Ratio 16:9
- Color
Keywords
- #Content-Based Slides
- #Design-Based Slides
- #Company Introduction
- #Market and Competitor Analysis
- #Other
- #Global Network
- #Target Market
- #Map
- #16:9
- #CSR map PowerPoint slide
- #global network visualization slide
- #world map presentation template
- #corporate social responsibility PPT
- #how to present CSR activities in PowerPoint
About the Product
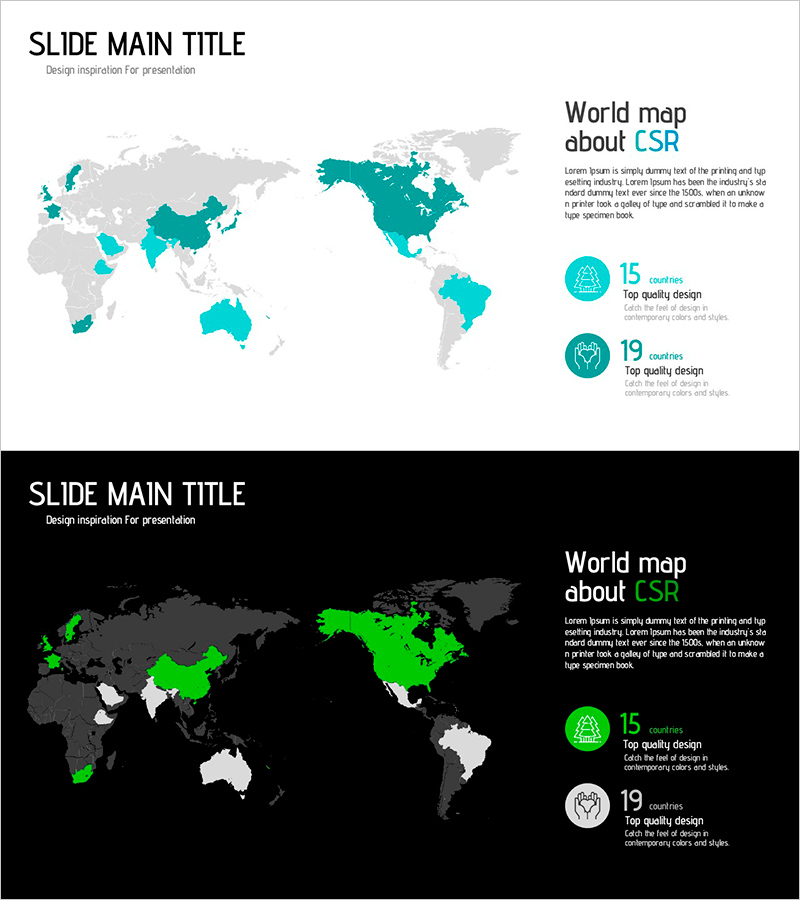
A PowerPoint slide that visualizes corporate social responsibility (CSR) activities across a world map with two distinct color schemes. The light background version features turquoise accents, while the dark background version uses lime green highlights, allowing you to choose based on your presentation tone. Each slide displays regional CSR participation with numeric data (15 countries, 19 countries) represented through circular icons and accompanying text descriptions. The layout separates explanatory text from data visualization areas, making it ideal for investor presentations and sustainability reports. Delivered in 16:9 widescreen format with 2 slides, this deck effectively communicates global network reach and corporate responsibility impact at a glance.
Usage Points
-
Main Usage
Visualize your organization's global CSR footprint and international participation scope through an intuitive world map interface. Communicate corporate social responsibility achievements to investors, partners, and stakeholders with data-driven credibility. Color-coded regional emphasis immediately highlights areas of concentrated CSR activity.
-
How to Use
Insert into company profile presentations under the Global Network or Corporate Responsibility section. Use in investor relations materials for ESG activity pages or sustainability reports showcasing international cooperation. Select the light-background version for standard presentations or the dark-background version for premium, high-impact decks.
-
Recommended For
Executive leadership, investor relations teams, CSR departments, sustainability report authors, and global partnership managers presenting international business scope and social responsibility initiatives. Ideal for investor meetings, shareholder assemblies, corporate briefings, and stakeholder communications requiring credible data visualization.
-
Slide Structure
Each slide features a title area at the top, a central world map visualization with color-coded regions, and a right-side panel containing text descriptions and numeric data. The map displays specific country counts (15 countries, 19 countries) via circular icons with accompanying legend and explanatory text, creating a clear information hierarchy.
Related Products
-

Global Target Country Map – Market Entry Strategy
#Company Introduction #Market and Competitor Analysis #Other
-

Target Country Analysis Map – Insights into Global Markets
#Company Introduction #Market and Competitor Analysis #Graph
-

Global National Goal Setting Map – Target Market Visualization
#Company Introduction #Market and Competitor Analysis #Other
-

Black Blue Global Map for Global Network
#Company Introduction #Market and Competitor Analysis #Other
