Visualization of Major Sales Growth Segments – Performance and Strategy
RB0800002_6
- Last Update 03/17/2025
- File Size 0.1MB
- # of Slides 2
- File Format PPTX
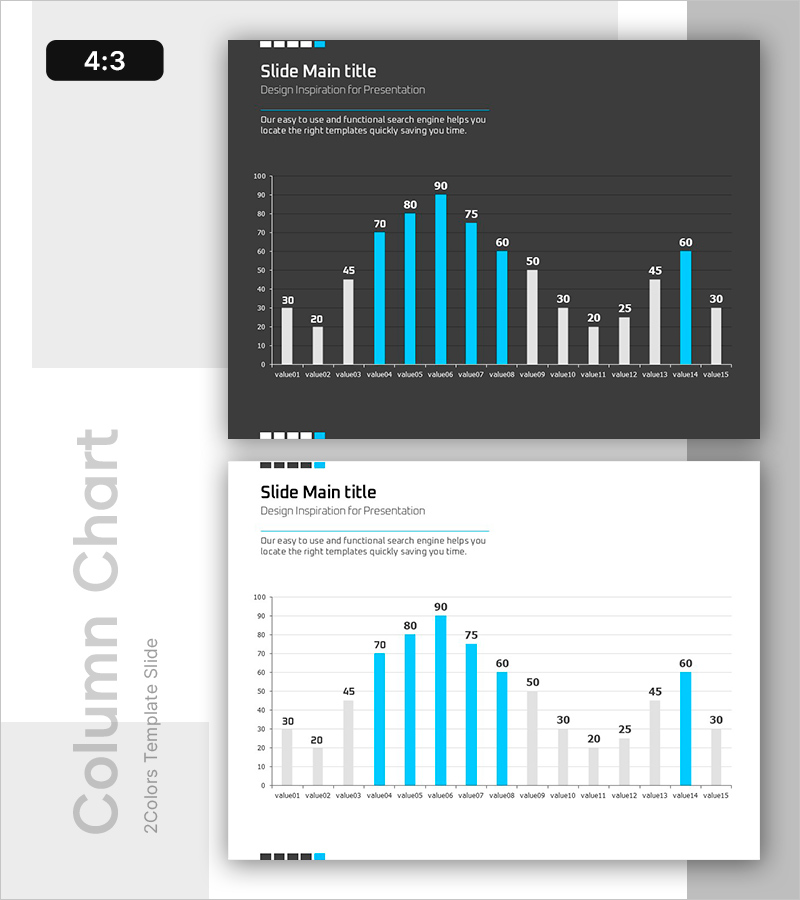
- Slide Ratio 4:3
- Color
Keywords
- #Content-Based Slides
- #Design-Based Slides
- #Business Strategy
- #Financial Plans and Performance
- #Graph
- #Achievements
- #Sales and Revenue
- #Column
- #Column Chart
- #4:3
- #vertical bar chart PowerPoint
- #sales comparison chart slide
- #data visualization template
- #bar graph presentation
- #business performance slides
- #financial data PowerPoint template
About the Product
A vertical bar chart PowerPoint slide that clearly visualizes sales performance across multiple data points. The dark gray background features cyan blue and white bar series comparing 15 data items, with numerical values displayed above each bar for precise information delivery. Delivered as a 2-slide set in 4:3 aspect ratio, ready for immediate use in presentations. Effectively communicates sales trends and performance analysis during business strategy planning and financial reporting.
Usage Points
-
Main Usage
Compare quarterly, monthly, or product-level sales performance using a vertical bar chart format, visually highlighting growth and plateau segments to clearly communicate business results. Supports data-driven decision-making in financial reports, business plans, and investor presentations.
-
How to Use
The dark gray background provides contrast for cyan blue bars representing primary metrics and white bars for comparison items, creating visual distinction. Numerical labels above each bar display exact values, and additional text annotations can emphasize key insights or trends.
-
Recommended For
Finance teams, business planning departments, and executives presenting sales results and performance analysis. Ideal for quarterly earnings presentations, investor briefings, internal management meetings, and marketing performance reviews where quantitative data communication is essential.
-
Slide Structure
2-slide set with identical layouts featuring 15 data items displayed as vertical bars. Each slide uses a three-color system—cyan blue for emphasis, white for comparison, and gray for background—to establish information hierarchy. Horizontal gridlines and Y-axis tick marks facilitate value comparison and readability.
Related Products
-

Analysis of Factors Contributing to Excellent Sales Performance – Visualizing Success
#Business Strategy #Financial Plans and Performance #Graph
-

Blue Column Chart – Visualizing Sales Performance
#Business Strategy #Financial Plans and Performance #Graph
-

Breaking Sales Records – Visualizing Performance
#Business Strategy #Financial Plans and Performance #Graph
-

Vertical General Bar Chart – Clear Performance Analysis
#Business Strategy #Financial Plans and Performance #Graph
