Vertical General Bar Chart – Clear Performance Analysis
RB0800005_7
- Last Update 03/18/2025
- File Size 1.9MB
- # of Slides 2
- File Format PPTX
- Slide Ratio 4:3
- Color
Keywords
- #Content-Based Slides
- #Design-Based Slides
- #Business Strategy
- #Financial Plans and Performance
- #Graph
- #Achievements
- #Sales and Revenue
- #Column
- #Column Chart
- #4:3
- #vertical bar chart PowerPoint
- #bar graph slide template
- #performance comparison chart
- #sales data visualization
- #data chart PowerPoint slide
- #how to create bar chart in PowerPoint
About the Product
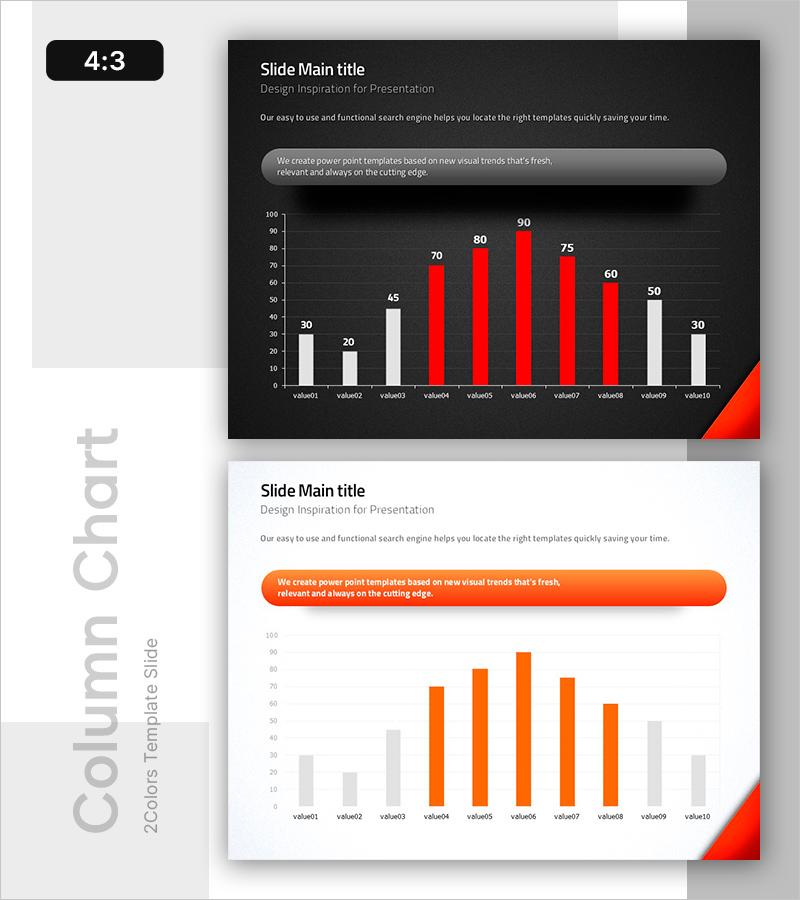
A vertical bar chart PowerPoint slide featuring a dark background with white and red bar series for clear data comparison. This slide displays 10 data points with red accent bars highlighting key performance metrics against white baseline bars. Ideal for presenting sales figures, quarterly results, departmental performance, product sales volume, and other quantitative business data. The 4:3 aspect ratio PPTX format integrates seamlessly into existing presentations for immediate use in financial reports, business reviews, and performance analysis decks.
Usage Points
-
Main Usage
This slide enables clear quantitative data comparison across multiple categories. The 10-item vertical bar layout allows simultaneous display of related metrics, with red accent bars drawing attention to peak values or critical performance indicators. Suitable for sales figures, quarterly earnings, departmental KPIs, product performance, customer satisfaction metrics, and market share analysis.
-
How to Use
Perfect for financial and management reports, business plan presentations, marketing strategy decks, and quarterly/annual performance reviews. The dark background ensures excellent visibility in projection environments, while the red accent bars guide audience attention to key data points. Easily customizable for different data sets and business contexts.
-
Recommended For
Finance and management executives, sales and marketing professionals, project managers, business consultants, and data analysts. Particularly effective for monthly/quarterly/annual performance presentations, departmental comparisons, product sales analysis, investor reports, and board-level business reviews.
-
Slide Structure
2-slide set. Top section contains title and subtitle areas. Main content features a vertical bar chart with 10 data points (Y-axis range 0-100, X-axis labeled value01 through value10). Bar composition: 3 white bars, 4 red accent bars, 3 white bars with numeric labels (30, 20, 45, 70, 80, 90, 75, 60, 50, 30) displayed above each bar. Bottom section includes descriptive text box.
Related Products
-

Breaking Sales Records – Visualizing Performance
#Business Strategy #Financial Plans and Performance #Graph
-

Blue Column Chart – Visualizing Sales Performance
#Business Strategy #Financial Plans and Performance #Graph
-

Analysis of Factors Contributing to Excellent Sales Performance – Visualizing Success
#Business Strategy #Financial Plans and Performance #Graph
-

Visualization of Major Sales Growth Segments – Performance and Strategy
#Business Strategy #Financial Plans and Performance #Graph
