Square Frame Presentation Template for Financial Performance – Efficiency and Clarity
RJ0200010_19
- Last Update 03/31/2025
- File Size 0.5MB
- # of Slides 2
- File Format PPTX
- Slide Ratio 16:9
- Color
Keywords
About the Product
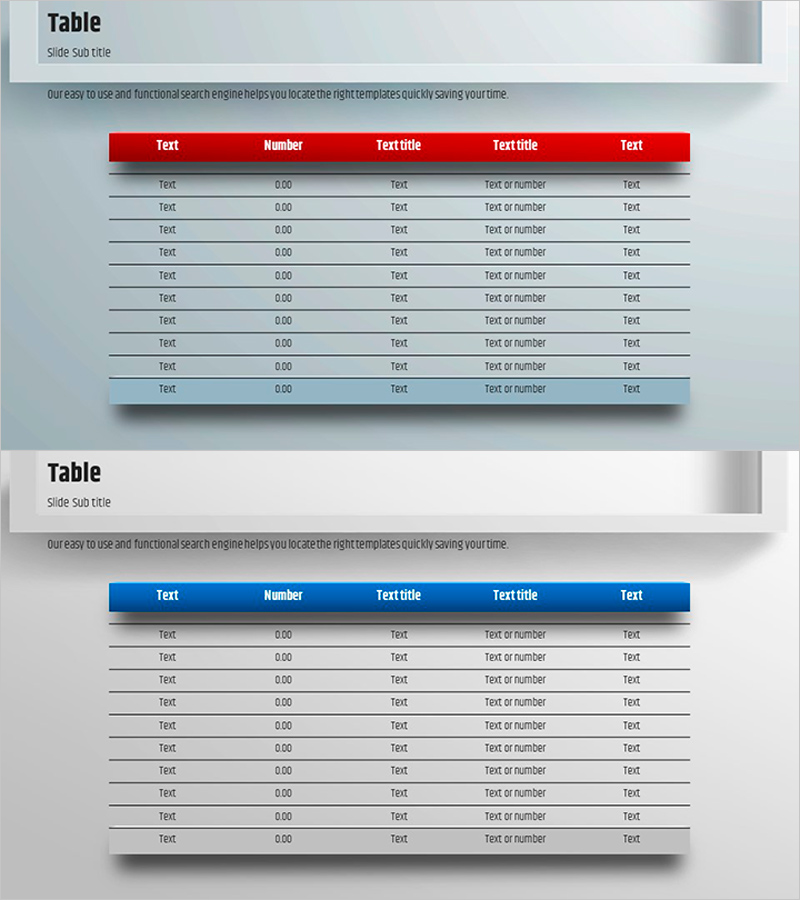
A 5-column data table PowerPoint slide designed to clearly visualize financial performance and business metrics. Available in two color options—red header and blue header—each slide includes 10 rows of input fields for text, numbers, and ratio data. The aligned matrix structure effectively communicates financial planning, sales results, cost analysis, and other business data. Provided in fully editable PPTX format to streamline presentation creation.
Usage Points
-
Main Usage
Present quantitative information—financial results, sales performance, cost analysis, market data—in a clear matrix structure to support decision-making and comparative analysis.
-
How to Use
Edit header row labels and input numerical or text data into each row. Choose between red or blue header based on presentation theme and corporate branding.
-
Recommended For
Finance teams presenting quarterly or annual results, marketing teams analyzing channel performance, sales teams reporting customer transaction volumes, executive-level business status reports.
-
Slide Structure
5 columns (text, number, text title, text title, text) × 10 rows of editable data fields. Includes one red-header slide and one blue-header slide for flexible color options.
Related Products
-

Basic Red Green Table – Visualizing Financial Performance
#Financial Plans and Performance #Diagram #Cash Flow Statement
-

Denim PPT Table Chart – Clearly Presenting Financial Performance
#Financial Plans and Performance #Diagram #Cash Flow Statement
-

Effective Note Template Table for Cash Flow Statements
#Financial Plans and Performance #Diagram #Cash Flow Statement
-

Modern Business Presentation Template Table - Visualizing Financial Plans and Performance
#Financial Plans and Performance #Diagram #Cash Flow Statement
