Denim PPT Table Chart – Clearly Presenting Financial Performance
RB0800023_15
- Last Update 03/22/2025
- File Size 7.4MB
- # of Slides 2
- File Format PPTX
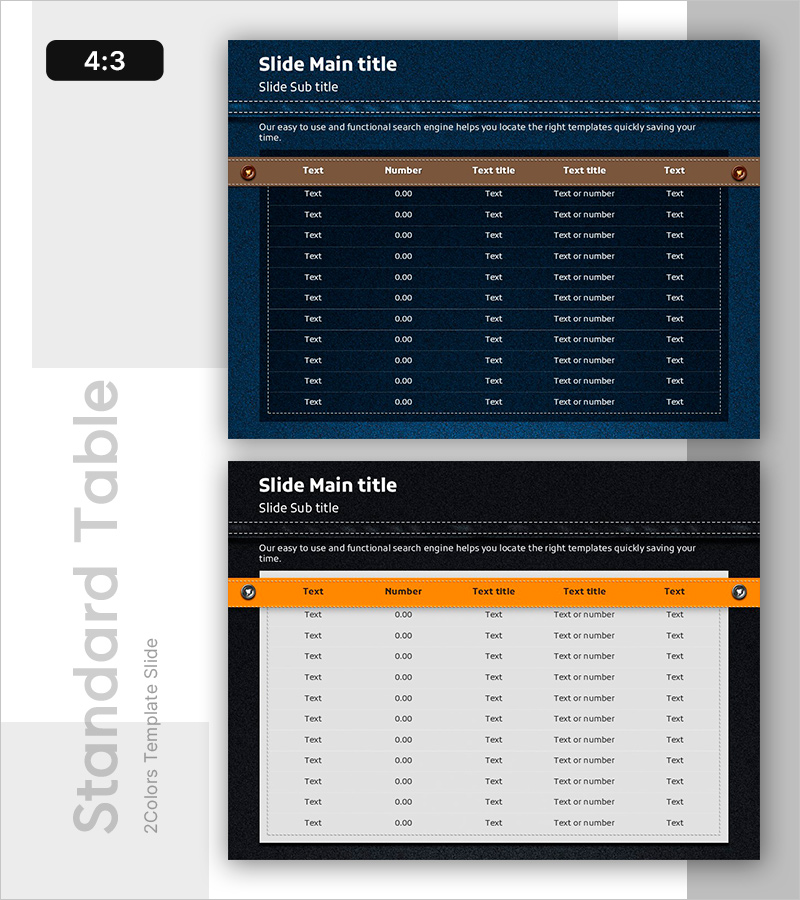
- Slide Ratio 4:3
- Color
Keywords
About the Product
A horizontal data table PowerPoint slide featuring a dark navy background with brown header and white text. The slide is structured with 5 columns and 10 rows, ideal for presenting financial performance, cash flow statements, sales figures, and other numerical data. Each cell is designed for easy text and number input, with dotted borders emphasizing the data area. Provided as a 2-slide set in 4:3 aspect ratio, ready for immediate use in reports, business plans, and financial presentations.
Usage Points
-
Main Usage
This slide is designed to organize and compare numerical information such as financial data, sales figures, and performance metrics in a structured table format. The contrast between the dark navy background and brown header highlights key information, while dotted borders clearly define the data area.
-
How to Use
Use this slide in reports, business plans, and financial presentations to display quarterly results, departmental performance, product sales, and other data-driven insights. Simply input your text and numbers directly into each cell, and expand rows and columns as needed for your specific data requirements.
-
Recommended For
Ideal for finance teams, executives, business development professionals, and marketing teams who need to present data-driven reports and analysis. Particularly useful for quarterly earnings presentations, investor reports, and internal performance review meetings.
-
Slide Structure
2-slide set with 4:3 aspect ratio. Each slide contains 5 columns (Text, Number, Text title, Text title, Text) and 10 data entry rows. The brown header row accommodates column titles, with 10 rows below for data input. Dotted borders define the data entry area.
Related Products
-

Teal Table Chart in Sky Template
#Financial Plans and Performance #Diagram #Cash Flow Statement
-

Square Frame Presentation Template for Financial Performance – Efficiency and Clarity
#Financial Plans and Performance #Diagram #Cash Flow Statement
-

Table Chart with Light Background – Financial Planning Tool
#Financial Plans and Performance #Diagram #Cash Flow Statement
-

Idea Presentation Wide Table Slide – Financial Performance Overview
#Financial Plans and Performance #Diagram #Cash Flow Statement
