Light Basic Line Chart Slide – Data Visualization with Orange and Green
RB0800024_17
- Last Update 03/22/2025
- File Size 1.5MB
- # of Slides 2
- File Format PPTX
- Slide Ratio 4:3
- Color
Keywords
About the Product
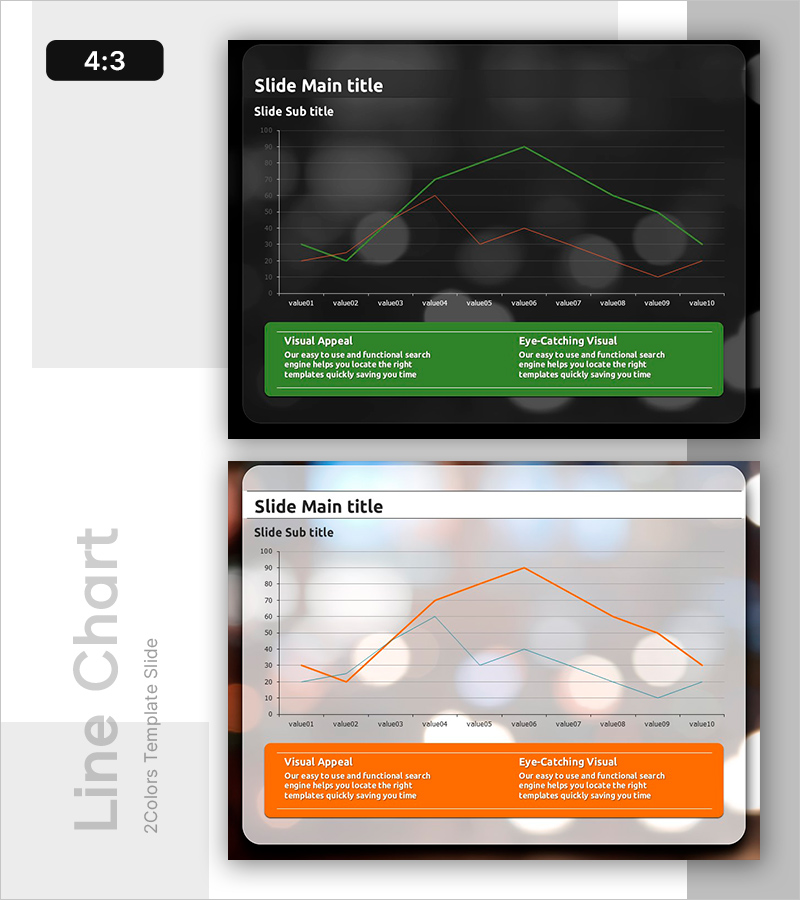
A multi-series line chart PowerPoint slide that clearly visualizes data trends across two distinct data sets. The dark background features orange and green line series tracking 10 data points to show comparative changes over time. Provided in 4:3 aspect ratio with 2 slide variations—a primary dark-background version and an alternative light-background design—making it immediately ready for sales analysis, performance comparison, and market trend presentations.
Usage Points
-
Main Usage
Ideal for comparing two data series over time—such as sales performance, KPI metrics, or market indicators. The orange and green color coding provides instant visual distinction between the two data lines, while 10 data points enable clear representation of monthly, quarterly, or annual trends.
-
How to Use
Replace the value01–value10 labels with your actual data points and numeric values; the line paths will adjust accordingly. Choose between the dark-background or light-background slide version based on your presentation theme. Add your title, subtitle, and descriptive text to the text boxes to complete the slide.
-
Recommended For
Finance, marketing, sales, and operations teams presenting quarterly or annual performance reports, market analysis, and executive KPI dashboards. Particularly effective when comparing two competing metrics or parallel performance indicators.
-
Slide Structure
2-slide set: Slide 1 features dark background with gridlines, dual orange and green line series, and lower text sections (Visual Appeal and Eye-Catching Visual areas). Slide 2 mirrors the chart structure on a light background. Both slides are 4:3 PPTX format with fully editable axis labels, legend, and data points.
Related Products
-

Maximizing Business Strategies with the Fruit Slice Year Chart – Key to Success
#Company Introduction #Business Strategy #Graph
-

Day and Night Phase Cumulative Progress – Data Visualization for Business Success
#Business Strategy #Market and Competitor Analysis #Graph
-

Horizontal Bar Chart Slide for Four-Year Change Figures
#Market and Competitor Analysis #Graph #Industry Trends
-

Idea Development Analysis Chart – Data-Driven Innovation
#Product/Service Introduction #Business Introduction #Diagram
