World Travel Two-Way Bar Graph
RJ0600080_16
- Last Update 07/11/2025
- File Size 0.2MB
- # of Slides 2
- File Format PPTX
- Slide Ratio 16:9
- Color
Keywords
- #Content-Based Slides
- #Design-Based Slides
- #Market and Competitor Analysis
- #Graph
- #Competitor Analysis
- #Competitive Advantage
- #Horizontal Bar
- #Double Horizontal Bar
- #16:9
- #two-way bar chart PowerPoint
- #bilateral bar graph slide template
- #comparative analysis chart
- #competitive comparison slide
- #market analysis PowerPoint template
About the Product
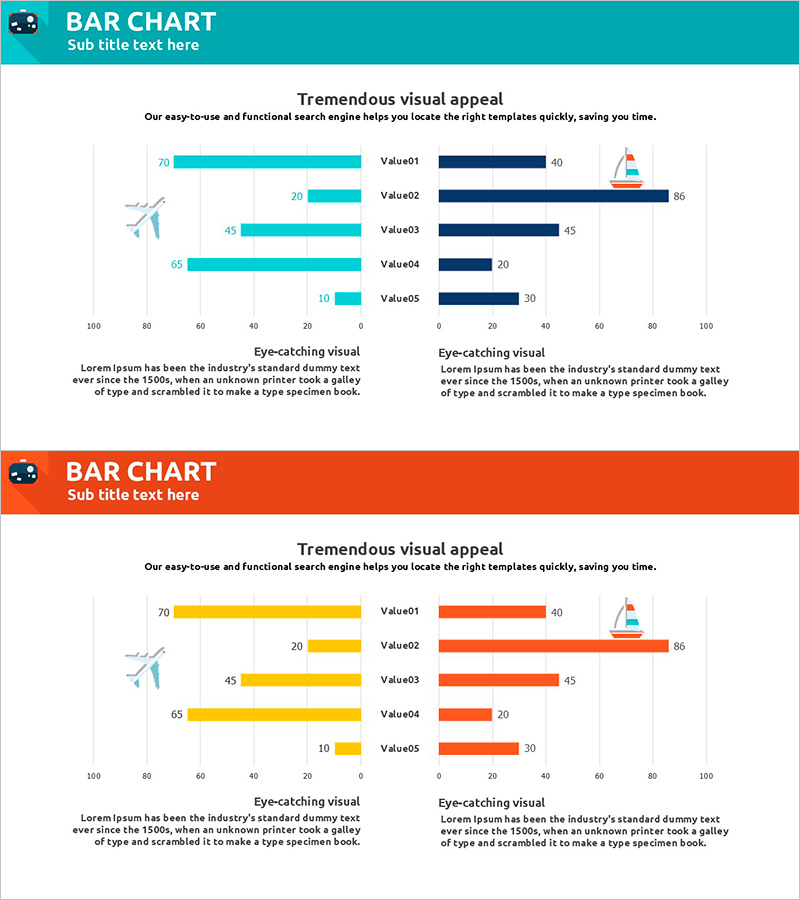
A symmetrical two-way bar chart PowerPoint slide featuring contrasting teal and navy colors for clear data comparison. This slide template displays five data points in opposite directions from a central baseline, making it ideal for comparative analysis. Perfect for travel statistics, market analysis, competitive benchmarking, and regional performance reviews. The 2-slide set uses 16:9 widescreen format in PPTX, allowing instant customization with your own data while maintaining professional visual balance.
Usage Points
-
Main Usage
This slide excels at displaying contrasting datasets side-by-side, making it perfect for comparative analysis. Use it to visualize travel statistics, market share comparisons, competitive performance metrics, or regional sales data. The symmetrical left-right structure instantly communicates relative differences between two groups or categories.
-
How to Use
Simply replace the five item labels and numerical values with your own data. Left-side bars represent the first group (e.g., Company A), while right-side bars represent the second group (e.g., Company B). Colors can remain as teal and navy or be customized to match your brand palette. Bar lengths automatically adjust proportionally to your data values.
-
Recommended For
Marketing managers, sales directors, and business analysts presenting competitive analysis, regional performance comparisons, or customer preference studies. Ideal for travel agencies, tourism boards, global enterprises comparing country-level metrics, consulting firms conducting benchmarking analysis, and financial institutions presenting product comparisons.
-
Slide Structure
Two slides featuring a central baseline with five symmetrical data items extending left and right. Left bars display in teal, right bars in navy blue, with numerical labels beside each bar. Title area at top and descriptive text area at bottom enable context-setting. 16:9 widescreen format, fully editable PPTX structure.
Related Products
-

Benchmarking with Bar Chart Comparison
#Market and Competitor Analysis #Diagram #Graph
-

Competitor Analysis Bar Graph – Check Market Advantage
#Market and Competitor Analysis #Graph #Competitor Analysis
-

Sailing Travel Service Company and Competitor Analysis Dual Horizontal Chart
#Market and Competitor Analysis #Graph #Competitor Analysis
-

Competitor Paired Bar Graph – Market Analysis and Comparison
#Market and Competitor Analysis #Graph #Competitor Analysis
