Technology Service Future Outlook and Expected Effect – High-Quality Graph Design
RJ0400027_12
- Last Update 05/25/2025
- File Size 4.9MB
- # of Slides 2
- File Format PPTX
- Slide Ratio 16:9
- Color
Keywords
- #Content-Based Slides
- #Design-Based Slides
- #Business Strategy
- #Market and Competitor Analysis
- #Graph
- #Financial Outlook & Expected Impact
- #Future Outlook
- #Column
- #Column Chart
- #16:9
- #positive negative column chart PowerPoint
- #vertical bar graph template
- #technology service slide
- #data comparison chart
- #how to create column chart in PowerPoint
- #business forecast slide template
About the Product
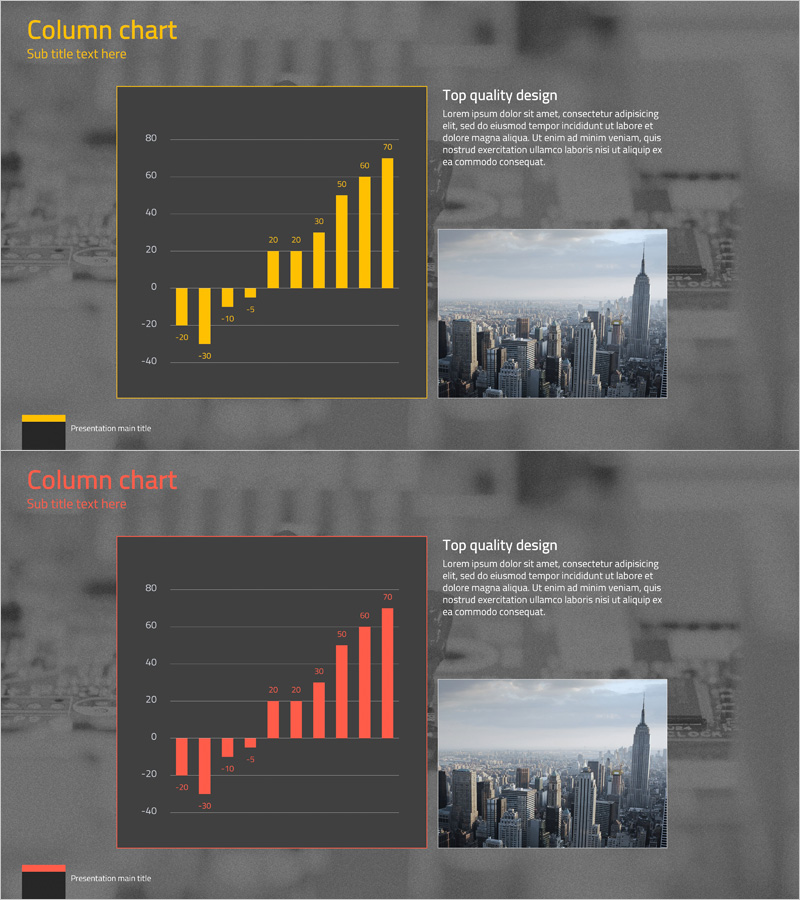
A 2-slide PowerPoint presentation featuring positive-negative column charts designed to visualize technology service future outlook and expected effects. The slides use dark backgrounds with yellow and red accent bars to create strong visual contrast, enabling simultaneous comparison of growth and risk indicators. Each slide displays 10 data points with clear numerical labels, making it ideal for market analysis, technology roadmap presentations, and performance forecasting. Delivered in 16:9 widescreen PPTX format for seamless compatibility across all presentation platforms.
Usage Points
-
Main Usage
Communicate technology service future outlook and expected effects through data-driven visualization to executives, investors, and stakeholders. The positive-negative column structure simultaneously highlights growth opportunities and potential risks, presenting a balanced analytical perspective.
-
How to Use
Apply in technology roadmap presentations, quarterly performance reports, investment pitch decks, and market analysis sessions. Replace chart values with actual company data, customize titles and legends to match your specific analysis, and adapt the structure for various comparative scenarios.
-
Recommended For
Technology company executives, strategy teams, marketing departments, and sales teams presenting future business direction and expected outcomes. Also suitable for consulting firms, financial institutions, and government agencies conducting technology industry analysis and policy presentations.
-
Slide Structure
2-slide set. Slide 1: Yellow-accent positive-negative column chart (10 data points, 0–80 range, labeled values) + right-side text area + cityscape image. Slide 2: Red-accent positive-negative column chart (identical structure) + right-side text area + cityscape image. Dark gray background with high-contrast color bars and white typography throughout.
Related Products
-

Growth Prospects Graph – Business Strategy Development
#Business Strategy #Market and Competitor Analysis #Graph
-

Elevation Graph Above Sofa Image - Visualizing Business Growth
#Business Strategy #Market and Competitor Analysis #Graph
-

Utilization Rate of Oriental Medicine Clinics by Age – Market and Competitor Analysis
#Business Strategy #Market and Competitor Analysis #Graph
-

Donation Participation Rate Graph – Business Strategy and Future Outlook
#Business Strategy #Market and Competitor Analysis #Graph
