Visualizing Trends with Area Chart – Intuitive Analysis
RB0800021_14
- Last Update 03/22/2025
- File Size 0.9MB
- # of Slides 2
- File Format PPTX
- Slide Ratio 4:3
- Color
Keywords
About the Product
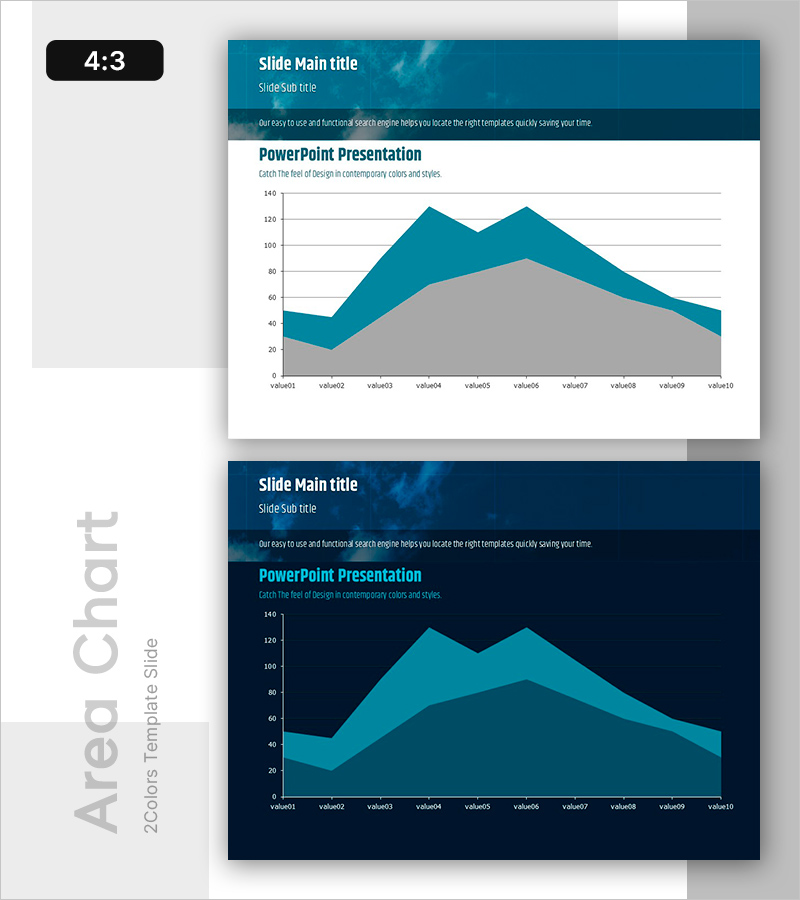
A PowerPoint slide featuring a 2-series area chart that visualizes data trends over time with teal and gray color layers. This area graph displays 10 data points across the horizontal axis (value01 to value10) with a vertical scale from 0 to 140, making it ideal for comparing growth patterns, market shifts, or performance metrics. The overlapping area design emphasizes both individual series movement and cumulative impact, enabling audiences to grasp complex data relationships at a glance. Perfect for business reports, financial presentations, marketing analysis, and quarterly performance reviews. Fully editable PPTX format with 2 slides ready for immediate customization.
Usage Points
-
Main Usage
Designed to compare and analyze multiple data series simultaneously over time. The area chart format allows viewers to see both individual series trends and their combined impact, making it perfect for illustrating market share evolution, revenue growth comparisons, customer segment performance, or any scenario requiring multi-series trend analysis.
-
How to Use
Insert this slide into the analysis or results section of your presentation. Simply select the chart, input your actual data values, and the graph updates automatically. Modify axis labels, legend text, and title to match your specific context. The 4:3 aspect ratio ensures compatibility with standard presentation displays.
-
Recommended For
Executive summaries, quarterly and annual performance reports, marketing campaign analysis, financial forecasting, investment pitch decks, consulting proposals, and academic presentations. Particularly effective when presenting historical trends to support strategic recommendations or investment decisions.
-
Slide Structure
Header section with title, subtitle, and descriptive text. Central area chart with 2 overlapping series (teal upper layer, gray lower layer) spanning 10 data points. Horizontal axis labeled value01–value10, vertical axis scaled 0–140. Clean grid background for easy value reading. 2-slide PPTX template in 4:3 format.
Related Products
-

Analysis of Online Learning Data Slide
#Market and Competitor Analysis #Diagram #Graph
-

Mokup and Turnout Analysis Chart – Analyze with Visual Data
#Market and Competitor Analysis #Graph #Other
-

Utilization Share of Natural Energy Sources - Visualizing Market Status with Pie Charts
#Market and Competitor Analysis #Graph #Market Status
-

Structure Presentation Template Doughnut Chart – Market Analysis and Marketing Strategy
#Market and Competitor Analysis #Marketing Plan and Strategy #Graph
