World Travel Template Area Chart
RJ0600080_8
- Last Update 07/12/2025
- File Size 0.2MB
- # of Slides 2
- File Format PPTX
- Slide Ratio 16:9
- Color
Keywords
About the Product
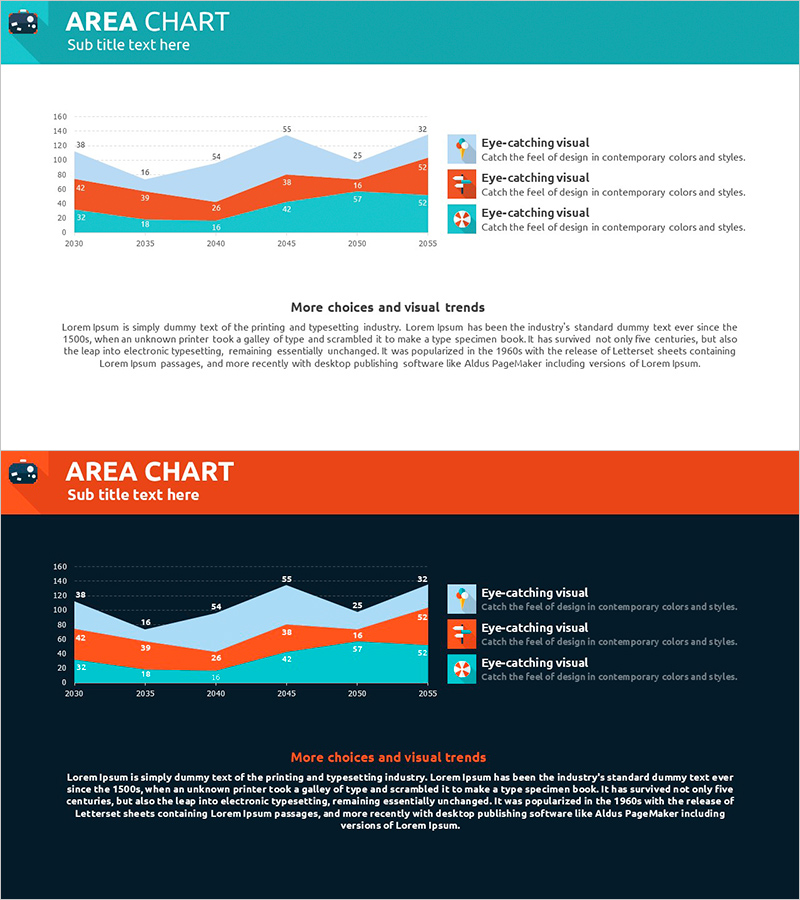
An optimized area chart PowerPoint slide for presentations analyzing market trends and competitive positioning. Visualizes time-series data from 2030 to 2055 across three distinct layers, making trend changes immediately apparent. Uses a turquoise-orange-blue gradient to clearly differentiate each data layer, with legend and numerical labels enhancing information readability. Ideal for business presentations, market analysis reports, and strategic planning decks where trend comparison and growth visualization are essential. Includes 2 slides in 16:9 widescreen format, ready for immediate editing and customization.
Usage Points
-
Main Usage
Visualizes multi-layer time-series data such as market trends, competitive positioning, and business performance. Enables simultaneous comparison of multiple indicators while maintaining clear visibility of overall trends.
-
How to Use
Deploy in the market analysis section early in presentations to illustrate competitor growth rates, market share evolution, or revenue composition trends. Replace legend labels and data values with your own information for immediate use.
-
Recommended For
Marketing strategists, business analysts, executives, and consultants preparing marketing plans, business proposals, investor pitch decks, and market research reports. Especially valuable for strategy presentations requiring multi-layer data comparison.
-
Slide Structure
Title area at top, central area chart with 3 data layers plus legend, and descriptive text area at bottom. Includes 3 legend items and 6 numerical labels within the chart for comprehensive data annotation.
Related Products
-

Study Area Chart - Market Status and Competitive Advantage
#Market and Competitor Analysis #Graph #Other
-

Market Analysis Using Pencil Bar Graph
#Market and Competitor Analysis #Graph #Other
-

Natural Landscape Illustration Graph – Market Status and Competitive Advantage
#Market and Competitor Analysis #Graph #Other
-

Meat and Vegetable Consumption by Region – Market Status Analysis
#Market and Competitor Analysis #Graph #Other
