Long-term Status Circular Graph
RJ0400037_6
- Last Update 05/27/2025
- File Size 6MB
- # of Slides 2
- File Format PPTX
- Slide Ratio 16:9
- Color
Keywords
About the Product
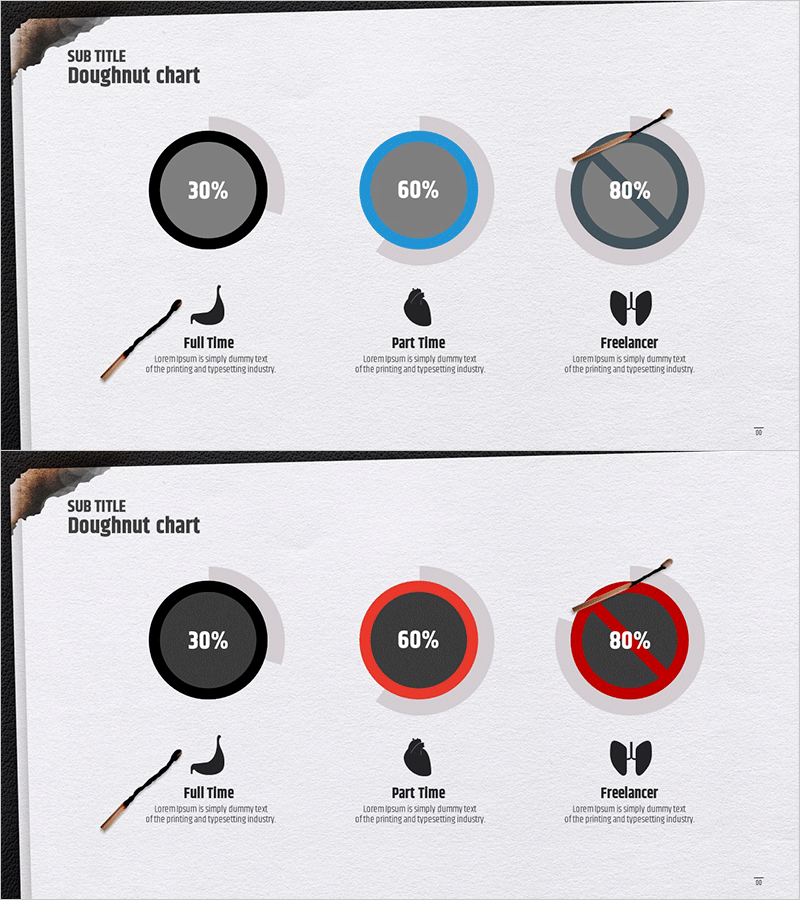
A PowerPoint slide featuring three doughnut charts to display ratio data across three categories. Each chart uses distinct color schemes—blue tone (black, blue, gray) and red tone (black, red, gray)—with icons and labels for clear category identification. The 2-slide set provides color variations to match your presentation theme and brand guidelines. Ideal for business status reports, technology assessments, workforce composition analysis, and any data-driven presentation requiring intuitive ratio visualization.
Usage Points
-
Main Usage
Visualizes the proportion, composition, and market share of three items using doughnut charts. Each chart displays percentage values and icons for quick audience comprehension. Perfect for business status analysis, technology reports, workforce composition explanations, and statistics-based presentations.
-
How to Use
Select the three doughnut charts on the slide and edit the numerical values and labels to match your data. Choose the color tone (blue or red) that aligns with your presentation topic and replace icons to clearly represent your categories. The 16:9 widescreen format ensures compatibility with modern presentation environments.
-
Recommended For
Executives, managers, analysts, marketers, and technical leaders preparing data-driven reports. Recommended for business plans, technology status reports, marketing analysis documents, investor presentations, and any material requiring emphasis on ratio information.
-
Slide Structure
Two-slide set, each containing three doughnut charts arranged horizontally. Slide 1 features blue tone coloring (black, blue, gray), while Slide 2 offers red tone variation (black, red, gray). Each doughnut displays percentage values in the center with icons and category labels positioned below for clarity.
Related Products
-

Donut Pie Chart for Medical Technology – Market Share Analysis
#Business Introduction #Market and Competitor Analysis #Graph
-

Business Project Development Status Analysis Graph
#Product/Service Introduction #Business Introduction #Graph
-

Financial Management Analysis Status Graph
#Product/Service Introduction #Business Introduction #Graph
-

Manufacturing Donut Circle Chart – Visual Data Representation
#Product/Service Introduction #Business Introduction #Graph
